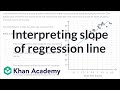
Understanding Scatter Plots and Trend Lines
Interactive Video
•
Mathematics, Education
•
7th - 10th Grade
•
Practice Problem
•
Hard

Liam Anderson
FREE Resource
Read more
5 questions
Show all answers
1.
MULTIPLE CHOICE QUESTION
30 sec • 1 pt
What was the main focus of the survey question in Liz's math test?
The average score of the class
The types of questions on the test
The number of hours students spent studying
The difficulty level of the test
2.
MULTIPLE CHOICE QUESTION
30 sec • 1 pt
What does the scatter plot in the video represent?
The relationship between study hours and test scores
The average score of students
The number of questions each student answered
The time taken by students to complete the test
3.
MULTIPLE CHOICE QUESTION
30 sec • 1 pt
How is the slope of the trend line interpreted in the context of the study?
Each additional point scored requires 1 more hour of study
Each additional point scored requires 15 more hours of study
Each additional hour of study decreases the score by 15 points
Each additional hour of study increases the score by 15 points
4.
MULTIPLE CHOICE QUESTION
30 sec • 1 pt
What does the model predict for a student who did not study at all?
They would score above 60 points
They would score zero points
They would score exactly 15 points
They would score between 35 and 40 points
5.
MULTIPLE CHOICE QUESTION
30 sec • 1 pt
Which statement correctly describes the model's prediction?
The score increases by 15 points for each additional hour of study
The study time decreases by 15 hours for each additional point scored
The study time increases by 15 hours for each additional point scored
The score decreases by 15 points for each additional hour of study
Access all questions and much more by creating a free account
Create resources
Host any resource
Get auto-graded reports
Continue with Google

Continue with Email
Continue with Microsoft
or continue with

%20(1).png)
Apple
Others
Already have an account?
