Heating and Cooling Curves of Water Explained
Interactive Video
•
Physics, Chemistry, Science
•
9th - 12th Grade
•
Practice Problem
•
Hard

Patricia Brown
FREE Resource
Read more
10 questions
Show all answers
1.
MULTIPLE CHOICE QUESTION
30 sec • 1 pt
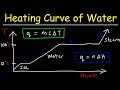
What is represented on the x-axis of the heating curve graph?
Time in seconds
Temperature in Celsius
Pressure in atmospheres
Total amount of heat energy added
2.
MULTIPLE CHOICE QUESTION
30 sec • 1 pt
During which segment of the heating curve does the temperature of ice remain constant?
Segment 1
Segment 3
Segment 4
Segment 2
3.
MULTIPLE CHOICE QUESTION
30 sec • 1 pt
What happens to the potential energy during the phase change from ice to liquid water?
It decreases
It remains constant
It increases
It fluctuates
4.
MULTIPLE CHOICE QUESTION
30 sec • 1 pt
Which segment of the heating curve involves the enthalpy of vaporization?
Segment 1
Segment 3
Segment 2
Segment 4
5.
MULTIPLE CHOICE QUESTION
30 sec • 1 pt
How does a high specific heat capacity affect the slope of a heating curve?
It makes the slope steeper
It makes the slope shallower
It has no effect
It reverses the slope
6.
MULTIPLE CHOICE QUESTION
30 sec • 1 pt
What is the specific heat capacity of liquid water?
2 joules per gram per Celsius
4.18 joules per gram per Celsius
6 joules per gram per Celsius
8 joules per gram per Celsius
7.
MULTIPLE CHOICE QUESTION
30 sec • 1 pt
What type of process is the cooling curve of water?
Isothermal
Exothermic
Endothermic
Adiabatic
Access all questions and much more by creating a free account
Create resources
Host any resource
Get auto-graded reports
Continue with Google

Continue with Email
Continue with Classlink
Continue with Clever
or continue with
Microsoft
%20(1).png)
Apple
Others
Already have an account?
