Contingency Tables and Marginal Distribution
Interactive Video
•
Mathematics, Social Studies, Science
•
9th - 10th Grade
•
Practice Problem
•
Hard

Patricia Brown
FREE Resource
Read more
10 questions
Show all answers
1.
MULTIPLE CHOICE QUESTION
30 sec • 1 pt
What is the primary purpose of using a contingency table?
To predict future survey outcomes
To calculate the average of survey responses
To show the relationship between two variables with multiple categories
To display the count of responses for a single question survey
2.
MULTIPLE CHOICE QUESTION
30 sec • 1 pt
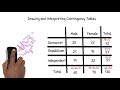
In the survey example, what are the two questions asked?
What is your gender and what is your political party?
What is your age and what is your favorite color?
What is your income level and what is your education level?
What is your occupation and where do you live?
3.
MULTIPLE CHOICE QUESTION
30 sec • 1 pt
How many total people were surveyed in the example provided?
130
120
150
100
4.
MULTIPLE CHOICE QUESTION
30 sec • 1 pt
What is the total number of Democrats in the survey?
60
51
42
37
5.
MULTIPLE CHOICE QUESTION
30 sec • 1 pt
How do you calculate the total number of males surveyed?
Divide the total number of males by the total number of females
Multiply the number of male Democrats by the number of male Republicans
Subtract the number of female Democrats from the total number of Democrats
Add the number of male Democrats, Republicans, and Independents
6.
MULTIPLE CHOICE QUESTION
30 sec • 1 pt
What is marginal distribution?
The percentage of each category in the margin of a contingency table
The average response rate in a survey
The total count of responses in a survey
The distribution of a single variable in a survey
7.
MULTIPLE CHOICE QUESTION
30 sec • 1 pt
How is the percentage of Democrats calculated in the marginal distribution?
By subtracting the number of Independents from the total surveyed
By dividing the number of Democrats by the number of Republicans
By multiplying the number of Democrats by 100
By dividing the number of Democrats by the total surveyed and multiplying by 100
Access all questions and much more by creating a free account
Create resources
Host any resource
Get auto-graded reports
Continue with Google

Continue with Email
Continue with Classlink
Continue with Clever
or continue with
Microsoft
%20(1).png)
Apple
Others
Already have an account?
