Conditional and Marginal Distributions
Interactive Video
•
Mathematics, Social Studies, Science
•
9th - 10th Grade
•
Practice Problem
•
Hard

Patricia Brown
FREE Resource
Read more
10 questions
Show all answers
1.
MULTIPLE CHOICE QUESTION
30 sec • 1 pt
What is one method mentioned for making comparisons in contingency tables?
Using scatter plots
Using pie charts
Drawing side-by-side graphs
Creating line graphs
2.
MULTIPLE CHOICE QUESTION
30 sec • 1 pt
What does marginal distribution help us understand?
The distribution within a specific category
Percentages calculated from the margins of a table
The total number of categories
The relationship between two variables
3.
MULTIPLE CHOICE QUESTION
30 sec • 1 pt
How is the percentage of a category calculated in marginal distribution?
By subtracting the category count from the total
By adding all category counts and dividing by the total
By multiplying the category count by the total
By dividing the category count by the total and multiplying by 100
4.
MULTIPLE CHOICE QUESTION
30 sec • 1 pt
What does conditional distribution focus on?
Specific categories within the data
The total number of categories
The relationship between two variables
The entire sample
5.
MULTIPLE CHOICE QUESTION
30 sec • 1 pt
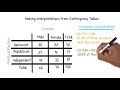
In the example of independent voters, what percentage of them were female?
37.3%
45.7%
62.7%
28.5%
6.
MULTIPLE CHOICE QUESTION
30 sec • 1 pt
What is the significance of different percentages in conditional distributions?
They suggest an association between variables
They confirm the data is incorrect
They show a strong correlation
They indicate no association
7.
MULTIPLE CHOICE QUESTION
30 sec • 1 pt
What percentage of males were identified as Republicans in the example?
22.9%
35%
45.7%
31.4%
Access all questions and much more by creating a free account
Create resources
Host any resource
Get auto-graded reports
Continue with Google

Continue with Email
Continue with Classlink
Continue with Clever
or continue with
Microsoft
%20(1).png)
Apple
Others
Already have an account?
