Global Carbon Emissions and Growth
Interactive Video
•
Science
•
9th - 10th Grade
•
Practice Problem
•
Hard

Patricia Brown
FREE Resource
Read more
10 questions
Show all answers
1.
MULTIPLE CHOICE QUESTION
30 sec • 1 pt
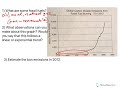
What is the time span of the global carbon dioxide emissions graph discussed in the video?
1800 to 2020
2000 to 2023
1751 to 2012
1900 to 2012
2.
MULTIPLE CHOICE QUESTION
30 sec • 1 pt
Which of the following is NOT a common fossil fuel?
Coal
Natural Gas
Solar Energy
Oil
3.
MULTIPLE CHOICE QUESTION
30 sec • 1 pt
What is a key characteristic of fossil fuels?
They are renewable
They are non-renewable
They are man-made
They are unlimited
4.
MULTIPLE CHOICE QUESTION
30 sec • 1 pt
How did global carbon emissions change from 1751 to 1900 according to the graph?
They remained flat
They decreased
They increased slightly
They increased dramatically
5.
MULTIPLE CHOICE QUESTION
30 sec • 1 pt
What type of growth does the graph of carbon emissions after the 1960s represent?
Linear
Exponential
Cyclical
Random
6.
MULTIPLE CHOICE QUESTION
30 sec • 1 pt
What is the main difference between linear and exponential growth?
Linear growth is constant, exponential growth is not
Both are constant
Neither is constant
Exponential growth is constant, linear growth is not
7.
MULTIPLE CHOICE QUESTION
30 sec • 1 pt
What is the estimated global carbon emissions in 2012 according to the graph?
8500 million tons
9000 million tons
9750 million tons
10500 million tons
Access all questions and much more by creating a free account
Create resources
Host any resource
Get auto-graded reports
Continue with Google

Continue with Email
Continue with Classlink
Continue with Clever
or continue with
Microsoft
%20(1).png)
Apple
Others
Already have an account?
