Average Rate of Change Concepts
Interactive Video
•
Mathematics
•
9th - 10th Grade
•
Practice Problem
•
Hard

Mia Campbell
FREE Resource
Read more
10 questions
Show all answers
1.
MULTIPLE CHOICE QUESTION
30 sec • 1 pt
What is the main task in the given problem?
To determine the y-intercept of the graph.
To estimate the average rate of change over a specific interval.
To calculate the area under the curve.
To find the maximum value of the graph.
2.
MULTIPLE CHOICE QUESTION
30 sec • 1 pt
What does the term 'interval' refer to in this context?
The y-axis range.
The slope of the graph.
The x-axis range.
The area under the graph.
3.
MULTIPLE CHOICE QUESTION
30 sec • 1 pt
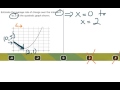
Which points are identified on the graph for calculating the average rate of change?
(1, 3) and (3, 1)
(0, 1) and (2, 5)
(0, 5) and (2, 1)
(0, 0) and (2, 2)
4.
MULTIPLE CHOICE QUESTION
30 sec • 1 pt
What is the significance of connecting the two identified points on the graph?
It calculates the area under the curve.
It indicates the y-intercept of the graph.
It represents the average rate of change over the interval.
It shows the maximum value of the graph.
5.
MULTIPLE CHOICE QUESTION
30 sec • 1 pt
Why can the average rate of change not be positive in this scenario?
Because the graph is decreasing.
Because the graph is increasing.
Because the graph is a straight line.
Because the graph is constant.
6.
MULTIPLE CHOICE QUESTION
30 sec • 1 pt
Which answer choices are eliminated due to the graph's decreasing nature?
All rates of change.
Zero rates of change.
Negative rates of change.
Positive rates of change.
7.
MULTIPLE CHOICE QUESTION
30 sec • 1 pt
What would a slope of zero indicate about the graph?
The graph is quadratic.
The graph is increasing.
The graph is decreasing.
The graph is constant.
Access all questions and much more by creating a free account
Create resources
Host any resource
Get auto-graded reports
Continue with Google

Continue with Email
Continue with Classlink
Continue with Clever
or continue with
Microsoft
%20(1).png)
Apple
Others
Already have an account?
