Attendance and Exam Score Relationships
Interactive Video
•
Mathematics
•
9th - 10th Grade
•
Practice Problem
•
Hard

Lucas Foster
FREE Resource
Read more
8 questions
Show all answers
1.
MULTIPLE CHOICE QUESTION
30 sec • 1 pt
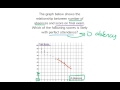
What does the graph illustrate in terms of student performance?
The relationship between class participation and exam scores.
The relationship between absences and exam scores.
The relationship between study hours and exam scores.
The relationship between homework completion and exam scores.
2.
MULTIPLE CHOICE QUESTION
30 sec • 1 pt
What is considered perfect attendance in the context of the graph?
Five absences per year.
Zero absences.
Two absences per semester.
One absence per month.
3.
MULTIPLE CHOICE QUESTION
30 sec • 1 pt
On which axis is the number of absences represented?
Y-axis
Z-axis
None of the above
X-axis
4.
MULTIPLE CHOICE QUESTION
30 sec • 1 pt
What is the significance of the Y-intercept in this graph?
It shows the average score of all students.
It marks the highest possible score on the exam.
It indicates the score with maximum absences.
It represents the score with zero absences.
5.
MULTIPLE CHOICE QUESTION
30 sec • 1 pt
How do you determine the Y-intercept from the graph?
By finding the point where the line crosses the X-axis.
By finding the point where the line crosses the Y-axis.
By identifying the highest point on the graph.
By calculating the average of all scores.
6.
MULTIPLE CHOICE QUESTION
30 sec • 1 pt
What is the predicted test score with perfect attendance?
100
85
95
90
7.
MULTIPLE CHOICE QUESTION
30 sec • 1 pt
Why is the test score of 100 considered likely with perfect attendance?
Because it is the average score of all students.
Because it is the highest score achieved by any student.
Because it is the Y-intercept of the graph.
Because it is the most common score among students.
Access all questions and much more by creating a free account
Create resources
Host any resource
Get auto-graded reports
Continue with Google

Continue with Email
Continue with Classlink
Continue with Clever
or continue with
Microsoft
%20(1).png)
Apple
Others
Already have an account?
