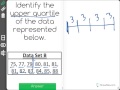
Understanding Quartiles and Data Sets
Interactive Video
•
Mathematics
•
9th - 10th Grade
•
Practice Problem
•
Hard

Olivia Brooks
FREE Resource
Read more
5 questions
Show all answers
1.
MULTIPLE CHOICE QUESTION
30 sec • 1 pt
How many data points are there in the given data set?
15
20
10
12
2.
MULTIPLE CHOICE QUESTION
30 sec • 1 pt
Into how many parts is the data set divided to determine quartiles?
5
2
3
4
3.
MULTIPLE CHOICE QUESTION
30 sec • 1 pt
Which quartile includes the first three numbers in a data set?
Upper quartile
Lower quartile
Middle quartile
Interquartile range
4.
MULTIPLE CHOICE QUESTION
30 sec • 1 pt
What is the value of the upper quartile in the given data set?
82.5
83.5
83
84
5.
MULTIPLE CHOICE QUESTION
30 sec • 1 pt
What is the significance of the value 83.5 in the data set?
It is the mode
It is the upper quartile
It is the lower quartile
It is the median
Access all questions and much more by creating a free account
Create resources
Host any resource
Get auto-graded reports
Continue with Google

Continue with Email
Continue with Classlink
Continue with Clever
or continue with
Microsoft
%20(1).png)
Apple
Others
Already have an account?
Popular Resources on Wayground

15 questions
Fractions on a Number Line
Quiz
•
3rd Grade
20 questions
Equivalent Fractions
Quiz
•
3rd Grade
25 questions
Multiplication Facts
Quiz
•
5th Grade
54 questions
Analyzing Line Graphs & Tables
Quiz
•
4th Grade
22 questions
fractions
Quiz
•
3rd Grade
20 questions
Main Idea and Details
Quiz
•
5th Grade
20 questions
Context Clues
Quiz
•
6th Grade
15 questions
Equivalent Fractions
Quiz
•
4th Grade
Discover more resources for Mathematics
20 questions
Graphing Inequalities on a Number Line
Quiz
•
6th - 9th Grade
18 questions
SAT Prep: Ratios, Proportions, & Percents
Quiz
•
9th - 10th Grade
12 questions
Exponential Growth and Decay
Quiz
•
9th Grade
12 questions
Parallel Lines Cut by a Transversal
Quiz
•
10th Grade
12 questions
Add and Subtract Polynomials
Quiz
•
9th - 12th Grade
15 questions
Combine Like Terms and Distributive Property
Quiz
•
8th - 9th Grade
20 questions
Function or Not a Function
Quiz
•
8th - 9th Grade
10 questions
Elijah McCoy: Innovations and Impact in Black History
Interactive video
•
6th - 10th Grade