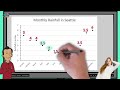
Interpreting Scatter Plots and Rainfall
Interactive Video
•
Mathematics
•
6th - 7th Grade
•
Practice Problem
•
Hard

Thomas White
FREE Resource
Read more
15 questions
Show all answers
1.
MULTIPLE CHOICE QUESTION
30 sec • 1 pt
What is the main topic of the video tutorial?
How to predict future rainfall
The history of Seattle's rainfall
Interpreting data on a scatter plot
How to create a scatter plot
2.
MULTIPLE CHOICE QUESTION
30 sec • 1 pt
What does the horizontal axis on the scatter plot represent?
The amount of rainfall in inches
The number of rainy days
The temperature in Seattle
The months of the year
3.
MULTIPLE CHOICE QUESTION
30 sec • 1 pt
What does the vertical axis on the scatter plot show?
The months of the year
The number of sunny days
The temperature in Seattle
The amount of rainfall in inches
4.
MULTIPLE CHOICE QUESTION
30 sec • 1 pt
In the month of April, how much rain was recorded according to the scatter plot?
Two inches
Five inches
Three inches
Four inches
5.
MULTIPLE CHOICE QUESTION
30 sec • 1 pt
What is the first step in interpreting a scatter plot?
Count the number of data points
Find the average of the data points
Identify the title of the plot
Label the axes
6.
MULTIPLE CHOICE QUESTION
30 sec • 1 pt
What is the purpose of a scatter plot?
To show the relationship between two variables
To calculate the average of a dataset
To list data in a table format
To display data in a pie chart
7.
MULTIPLE CHOICE QUESTION
30 sec • 1 pt
What should you do if you want to find the total rainfall for a specific month?
Add all the data points
Subtract the smallest data point from the largest
Look at the horizontal axis
Look at the vertical axis
Access all questions and much more by creating a free account
Create resources
Host any resource
Get auto-graded reports
Continue with Google

Continue with Email
Continue with Classlink
Continue with Clever
or continue with
Microsoft
%20(1).png)
Apple
Others
Already have an account?
Popular Resources on Wayground

15 questions
Fractions on a Number Line
Quiz
•
3rd Grade
10 questions
Probability Practice
Quiz
•
4th Grade
15 questions
Probability on Number LIne
Quiz
•
4th Grade
20 questions
Equivalent Fractions
Quiz
•
3rd Grade
25 questions
Multiplication Facts
Quiz
•
5th Grade
22 questions
fractions
Quiz
•
3rd Grade
6 questions
Appropriate Chromebook Usage
Lesson
•
7th Grade
10 questions
Greek Bases tele and phon
Quiz
•
6th - 8th Grade
Discover more resources for Mathematics
20 questions
Writing Algebraic Expressions
Quiz
•
6th Grade
20 questions
Ratios/Rates and Unit Rates
Quiz
•
6th Grade
14 questions
Volume of rectangular prisms
Quiz
•
7th Grade
15 questions
Graphing Inequalities
Quiz
•
7th - 9th Grade
20 questions
Graphing Inequalities on a Number Line
Quiz
•
6th - 9th Grade
20 questions
One Step Equations
Quiz
•
6th Grade
12 questions
One-Step Equations
Quiz
•
6th Grade
6 questions
Equations from models
Quiz
•
6th Grade