Graph Types and Their Uses
Interactive Video
•
Mathematics
•
6th - 8th Grade
•
Practice Problem
•
Hard

Thomas White
FREE Resource
Read more
26 questions
Show all answers
1.
MULTIPLE CHOICE QUESTION
30 sec • 1 pt
What are the two main questions to consider when choosing a graph or chart?
Is the data numerical or categorical and is it continuous?
What type of data do we have and what do we want to show?
What is the color of the data and how often is it updated?
How many data points are there and what is the data range?
2.
MULTIPLE CHOICE QUESTION
30 sec • 1 pt
Which type of data is best represented by a dot plot?
Large categorical data sets
Data with many subcategories
Small numerical data sets
Continuous data over time
3.
MULTIPLE CHOICE QUESTION
30 sec • 1 pt
What is a limitation of using a dot plot?
It is not suitable for large data sets
It does not show distribution
It is only for categorical data
It cannot show individual data points
4.
MULTIPLE CHOICE QUESTION
30 sec • 1 pt
How does a stem and leaf plot differ from a dot plot?
It is suitable for large data sets
It shows distribution more clearly
It is used for categorical data
It does not show individual data points
5.
MULTIPLE CHOICE QUESTION
30 sec • 1 pt
What is the main advantage of a stem and leaf plot?
It is suitable for categorical data
It is used for continuous data
It shows the distribution of data
It is easy to create for large data sets
6.
MULTIPLE CHOICE QUESTION
30 sec • 1 pt
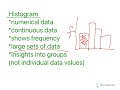
What type of data is best represented by a histogram?
Data with many subcategories
Small numerical data sets
Large numerical data sets
Categorical data
7.
MULTIPLE CHOICE QUESTION
30 sec • 1 pt
What is a key feature of a histogram?
Bars touch and show frequency
Bars do not touch
Used for categorical data
Shows individual data points
Access all questions and much more by creating a free account
Create resources
Host any resource
Get auto-graded reports
Continue with Google

Continue with Email
Continue with Microsoft
or continue with

%20(1).png)
Apple
Others
Already have an account?
