- Resource Library
- Math
- Probability And Statistics
- Measures Of Center
- Understanding Measures Of Center And Distribution Shapes
Understanding Measures of Center and Distribution Shapes
Interactive Video
•
Mathematics
•
9th - 10th Grade
•
Practice Problem
•
Hard

Thomas White
FREE Resource
Read more
46 questions
Show all answers
1.
MULTIPLE CHOICE QUESTION
30 sec • 1 pt
What is another term for the mean?
Middle value
Range
Mode
Average
2.
MULTIPLE CHOICE QUESTION
30 sec • 1 pt
What does the median represent in a data set?
The average value
The middle data point
The most frequent value
The range of values
3.
MULTIPLE CHOICE QUESTION
30 sec • 1 pt
When describing a distribution, which of the following is NOT a key component?
Shape
Center
Spread
Color
4.
MULTIPLE CHOICE QUESTION
30 sec • 1 pt
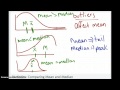
In a symmetrical distribution, how do the mean and median compare?
Mean is double the median
Mean and median are about the same
Mean is less than median
Mean is greater than median
5.
MULTIPLE CHOICE QUESTION
30 sec • 1 pt
What type of distribution is described as having a bell shape?
Bimodal
Symmetrical
Uniform
Skewed
6.
MULTIPLE CHOICE QUESTION
30 sec • 1 pt
In a right-skewed distribution, where is the mean located relative to the median?
Closer to the peak
Closer to the tail
Equal to the median
At the midpoint
7.
MULTIPLE CHOICE QUESTION
30 sec • 1 pt
Which measure of center should be used for a skewed distribution?
Mode
Median
Mean
Range
Access all questions and much more by creating a free account
Create resources
Host any resource
Get auto-graded reports
Continue with Google

Continue with Email
Continue with Classlink
Continue with Clever
or continue with
Microsoft
%20(1).png)
Apple
Others
Already have an account?
