Understanding Graphs and Distance
Interactive Video
•
Mathematics
•
4th - 5th Grade
•
Practice Problem
•
Hard

Thomas White
FREE Resource
Read more
7 questions
Show all answers
1.
MULTIPLE CHOICE QUESTION
30 sec • 1 pt
What is the main topic introduced in the video?
Understanding probability
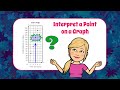
Interpreting points on a graph
Solving algebraic equations
Calculating area of shapes
2.
MULTIPLE CHOICE QUESTION
30 sec • 1 pt
What does the y-axis represent in the graph presented?
Time in hours
Speed in miles per hour
Fuel consumption in gallons
Total distance in miles
3.
MULTIPLE CHOICE QUESTION
30 sec • 1 pt
What are viewers encouraged to do after the question is presented?
Watch another video
Skip to the next section
Read a textbook
Pause and solve the problem
4.
MULTIPLE CHOICE QUESTION
30 sec • 1 pt
Which axis should you look at to find the time in hours?
Y-axis
Z-axis
X-axis
W-axis
5.
MULTIPLE CHOICE QUESTION
30 sec • 1 pt
What is the total distance Ty drove in the first three hours?
90 miles
120 miles
100 miles
110 miles
6.
MULTIPLE CHOICE QUESTION
30 sec • 1 pt
What is the final answer to the question about Ty's trip?
Ty drove 90 miles
Ty drove 100 miles
Ty drove 110 miles
Ty drove 120 miles
7.
MULTIPLE CHOICE QUESTION
30 sec • 1 pt
What is the purpose of the video series 'The Magic of Math'?
To improve language skills
To explore science concepts
To learn history through math
To master math one video at a time
Access all questions and much more by creating a free account
Create resources
Host any resource
Get auto-graded reports
Continue with Google

Continue with Email
Continue with Microsoft
or continue with

%20(1).png)
Apple
Others
Already have an account?
