Analyzing Data and Homework Time
Interactive Video
•
Mathematics
•
6th - 7th Grade
•
Practice Problem
•
Hard

Thomas White
FREE Resource
Read more
14 questions
Show all answers
1.
MULTIPLE CHOICE QUESTION
30 sec • 1 pt
What is the main purpose of today's lesson?
To practice solving math problems
To understand how data can be used to persuade
To study the history of data analysis
To learn about different types of graphs
2.
MULTIPLE CHOICE QUESTION
30 sec • 1 pt
How can companies use data to influence opinions?
By hiding data from the public
By using data to support their claims
By ignoring data altogether
By presenting data in a clear and honest way
3.
MULTIPLE CHOICE QUESTION
30 sec • 1 pt
In the homework time graph, why is the seventh-grade bar misleading?
It uses a different color
It is much larger than it should be
It is missing data points
It is not labeled correctly
4.
MULTIPLE CHOICE QUESTION
30 sec • 1 pt
What is the actual time difference between fourth and seventh graders' homework time?
Fourth graders spend 10 minutes more
Seventh graders spend 10 minutes more
Seventh graders spend 22 minutes more
Fourth graders spend 22 minutes more
5.
MULTIPLE CHOICE QUESTION
30 sec • 1 pt
How can graphs be made to look more fair?
By using 3D effects
By adding more data points
By starting the scale at zero
By using bright colors
6.
MULTIPLE CHOICE QUESTION
30 sec • 1 pt
What is a misleading scale in a graph?
A scale that uses different units
A scale that is too small
A scale that does not start at zero
A scale that uses too many numbers
7.
MULTIPLE CHOICE QUESTION
30 sec • 1 pt
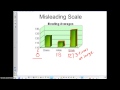
In the bowling scores example, why is Emily's score misleading?
Her score is missing data
Her score is too low
Her score is exaggerated compared to others
Her score is not shown
Access all questions and much more by creating a free account
Create resources
Host any resource
Get auto-graded reports
Continue with Google

Continue with Email
Continue with Classlink
Continue with Clever
or continue with
Microsoft
%20(1).png)
Apple
Others
Already have an account?
Similar Resources on Wayground
Popular Resources on Wayground

15 questions
Fractions on a Number Line
Quiz
•
3rd Grade
20 questions
Equivalent Fractions
Quiz
•
3rd Grade
25 questions
Multiplication Facts
Quiz
•
5th Grade
54 questions
Analyzing Line Graphs & Tables
Quiz
•
4th Grade
22 questions
fractions
Quiz
•
3rd Grade
20 questions
Main Idea and Details
Quiz
•
5th Grade
20 questions
Context Clues
Quiz
•
6th Grade
15 questions
Equivalent Fractions
Quiz
•
4th Grade
Discover more resources for Mathematics
22 questions
distributive property
Quiz
•
7th Grade
18 questions
Angle Relationships
Quiz
•
7th Grade
15 questions
Distributive Property & Review
Quiz
•
6th Grade
20 questions
Writing Algebraic Expressions
Quiz
•
6th Grade
20 questions
How Some Friendships Last — and Others Don’t Video Questions
Quiz
•
7th Grade
20 questions
Ratios/Rates and Unit Rates
Quiz
•
6th Grade
18 questions
Handbook Refresher Quiz
Quiz
•
7th Grade
20 questions
Graphing Inequalities on a Number Line
Quiz
•
6th - 9th Grade