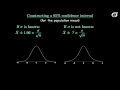
Understanding the t Distribution
Interactive Video
•
Mathematics
•
11th - 12th Grade
•
Practice Problem
•
Easy

Thomas White
Used 2+ times
FREE Resource
Read more
33 questions
Show all answers
1.
MULTIPLE CHOICE QUESTION
30 sec • 1 pt
What is the Student t distribution often used for?
Estimating the median of a population
Estimating the mean of a population when the standard deviation is known
Estimating the mean of a population when the standard deviation is unknown
Estimating the variance of a population
2.
MULTIPLE CHOICE QUESTION
30 sec • 1 pt
Why can't we use the population standard deviation in practice?
It is always one
It is often unknown
It is always zero
It is a constant
3.
MULTIPLE CHOICE QUESTION
30 sec • 1 pt
What replaces the population standard deviation in the t distribution?
Sample median
Sample variance
Sample standard deviation
Sample mean
4.
MULTIPLE CHOICE QUESTION
30 sec • 1 pt
What is a key characteristic of the t distribution?
It has a higher peak than the normal distribution
It is always symmetric
It has heavier tails than the normal distribution
It is always skewed
5.
MULTIPLE CHOICE QUESTION
30 sec • 1 pt
What is the degrees of freedom for a sample of size n?
n/2
n
n+1
n-1
6.
MULTIPLE CHOICE QUESTION
30 sec • 1 pt
What happens to the t distribution as the degrees of freedom increase?
It becomes identical to the standard normal distribution
It becomes more skewed
It becomes more variable
It becomes less symmetric
7.
MULTIPLE CHOICE QUESTION
30 sec • 1 pt
What is the shape of the t distribution compared to the standard normal distribution?
It is identical
It is flatter with heavier tails
It is more peaked
It is skewed
Access all questions and much more by creating a free account
Create resources
Host any resource
Get auto-graded reports
Continue with Google

Continue with Email
Continue with Classlink
Continue with Clever
or continue with
Microsoft
%20(1).png)
Apple
Others
Already have an account?
Popular Resources on Wayground

8 questions
Spartan Way - Classroom Responsible
Quiz
•
9th - 12th Grade
15 questions
Fractions on a Number Line
Quiz
•
3rd Grade
14 questions
Boundaries & Healthy Relationships
Lesson
•
6th - 8th Grade
20 questions
Equivalent Fractions
Quiz
•
3rd Grade
3 questions
Integrity and Your Health
Lesson
•
6th - 8th Grade
25 questions
Multiplication Facts
Quiz
•
5th Grade
9 questions
FOREST Perception
Lesson
•
KG
20 questions
Main Idea and Details
Quiz
•
5th Grade
Discover more resources for Mathematics
25 questions
Logos
Quiz
•
12th Grade
14 questions
Making Inferences From Samples
Quiz
•
7th - 12th Grade
16 questions
Properties of Quadrilaterals
Quiz
•
11th Grade
23 questions
8th grade math unit 5B Perfect Squares and Cubes
Quiz
•
6th - 12th Grade
15 questions
Exponential Growth & Decay Practice
Quiz
•
12th Grade
12 questions
Add and Subtract Polynomials
Quiz
•
9th - 12th Grade
10 questions
Quadratic Regression Practice
Quiz
•
7th - 12th Grade
20 questions
Triangle Congruence Statements Quiz
Quiz
•
9th - 12th Grade