- Resource Library
- Math
- Probability And Statistics
- Frequency Distribution
- Frequency Polygons And Class Intervals
Frequency Polygons and Class Intervals
Interactive Video
•
Mathematics
•
6th - 7th Grade
•
Practice Problem
•
Hard

Thomas White
FREE Resource
Read more
15 questions
Show all answers
1.
MULTIPLE CHOICE QUESTION
30 sec • 1 pt
What is the first step in drawing a histogram for a given frequency distribution?
Calculate the mean of the data
Identify the class intervals and their frequencies
Find the mode of the data
Draw the frequency polygon
2.
MULTIPLE CHOICE QUESTION
30 sec • 1 pt
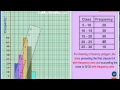
Which of the following is a correct class interval from the given distribution?
15 to 20
10 to 20
0 to 5
30 to 35
3.
MULTIPLE CHOICE QUESTION
30 sec • 1 pt
What is the frequency for the class interval 20 to 25?
30
20
10
40
4.
MULTIPLE CHOICE QUESTION
30 sec • 1 pt
What is the intersection point of the x-axis and y-axis called?
Base
Midpoint
Vertex
Origin
5.
MULTIPLE CHOICE QUESTION
30 sec • 1 pt
On the x-axis, what does one centimeter represent?
Ten frequencies
Five frequencies
Ten classes
Five classes
6.
MULTIPLE CHOICE QUESTION
30 sec • 1 pt
What is the frequency for the class interval 25 to 30?
20
10
30
40
7.
MULTIPLE CHOICE QUESTION
30 sec • 1 pt
What is the purpose of adding a preceding and succeeding class with zero frequency?
To balance the data
To extend the frequency polygon
To calculate the mean
To find the mode
Access all questions and much more by creating a free account
Create resources
Host any resource
Get auto-graded reports
Continue with Google

Continue with Email
Continue with Microsoft
or continue with

%20(1).png)
Apple
Others
Already have an account?
