Data Analysis and Interpretation Concepts
Interactive Video
•
Mathematics
•
9th - 10th Grade
•
Hard

Thomas White
FREE Resource
Read more
16 questions
Show all answers
1.
MULTIPLE CHOICE QUESTION
30 sec • 1 pt
What is the primary purpose of using box plots in data analysis?
To display the mean of the data set
To find the mode of the data set
To compare different sets of data
To calculate the standard deviation
2.
MULTIPLE CHOICE QUESTION
30 sec • 1 pt
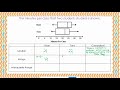
Which part of a box plot represents the least value in the data set?
The line inside the box
The end of the whisker
The point where the whisker and box connect
The end of the box
3.
MULTIPLE CHOICE QUESTION
30 sec • 1 pt
What does the line inside the box of a box plot represent?
The range
The median
The mode
The mean
4.
MULTIPLE CHOICE QUESTION
30 sec • 1 pt
In comparing medians, what does a higher median indicate about a class period's performance?
The class typically scores lower
The class has a wider range of scores
The class typically scores higher
The class has more consistent scores
5.
MULTIPLE CHOICE QUESTION
30 sec • 1 pt
How is the range of a data set calculated?
By finding the difference between the first and third quartiles
By averaging all the data points
By subtracting the least value from the greatest value
By adding the least and greatest values
6.
MULTIPLE CHOICE QUESTION
30 sec • 1 pt
What does it mean if two data sets have the same range?
They have the same median
They have the same interquartile range
They have the same spread of data
They have the same mean
7.
MULTIPLE CHOICE QUESTION
30 sec • 1 pt
How is the interquartile range (IQR) calculated?
By adding the first and third quartiles
By subtracting the median from the mean
By finding the difference between the least and greatest values
By subtracting the first quartile from the third quartile
Access all questions and much more by creating a free account
Create resources
Host any resource
Get auto-graded reports
Continue with Google

Continue with Email
Continue with Classlink
Continue with Clever
or continue with
Microsoft
%20(1).png)
Apple
Others
Already have an account?
Popular Resources on Wayground

15 questions
Fractions on a Number Line
Quiz
•
3rd Grade
20 questions
Equivalent Fractions
Quiz
•
3rd Grade
25 questions
Multiplication Facts
Quiz
•
5th Grade
54 questions
Analyzing Line Graphs & Tables
Quiz
•
4th Grade
22 questions
fractions
Quiz
•
3rd Grade
20 questions
Main Idea and Details
Quiz
•
5th Grade
20 questions
Context Clues
Quiz
•
6th Grade
15 questions
Equivalent Fractions
Quiz
•
4th Grade
Discover more resources for Mathematics
20 questions
Graphing Inequalities on a Number Line
Quiz
•
6th - 9th Grade
18 questions
SAT Prep: Ratios, Proportions, & Percents
Quiz
•
9th - 10th Grade
12 questions
Exponential Growth and Decay
Quiz
•
9th Grade
12 questions
Parallel Lines Cut by a Transversal
Quiz
•
10th Grade
12 questions
Add and Subtract Polynomials
Quiz
•
9th - 12th Grade
15 questions
Combine Like Terms and Distributive Property
Quiz
•
8th - 9th Grade
20 questions
Function or Not a Function
Quiz
•
8th - 9th Grade
10 questions
Elijah McCoy: Innovations and Impact in Black History
Interactive video
•
6th - 10th Grade