Year 8 climograph worksheets and printables help students analyze climate data through interactive practice problems, featuring free PDF downloads with comprehensive answer keys for mastering weather pattern interpretation skills.
Explore printable Climograph worksheets for Year 8
Climograph worksheets for Year 8 students available through Wayground (formerly Quizizz) provide comprehensive practice in interpreting and analyzing climate data through visual representations. These educational resources strengthen critical geography skills by teaching students to read temperature and precipitation graphs, identify climate patterns, and connect geographic location with weather data. The worksheet collection includes diverse practice problems that guide students through understanding how climographs display monthly temperature averages and rainfall amounts, enabling them to recognize different climate zones and seasonal variations. Each printable resource comes with detailed answer keys that support both independent learning and classroom instruction, while the free pdf format ensures easy access and distribution for educational purposes.
Wayground (formerly Quizizz) empowers educators with an extensive library of millions of teacher-created climograph resources specifically designed for Year 8 social studies instruction. The platform's advanced search and filtering capabilities allow teachers to quickly locate worksheets that align with specific curriculum standards and learning objectives, while differentiation tools enable customization for diverse student needs and ability levels. These flexible resources are available in both printable and digital formats, including downloadable pdf versions, making them ideal for various instructional settings from traditional classrooms to remote learning environments. Teachers can effectively utilize these materials for lesson planning, targeted remediation of geographic concepts, enrichment activities for advanced learners, and ongoing skill practice that reinforces students' ability to interpret complex climate data representations.
FAQs
How do I teach students to read a climograph?
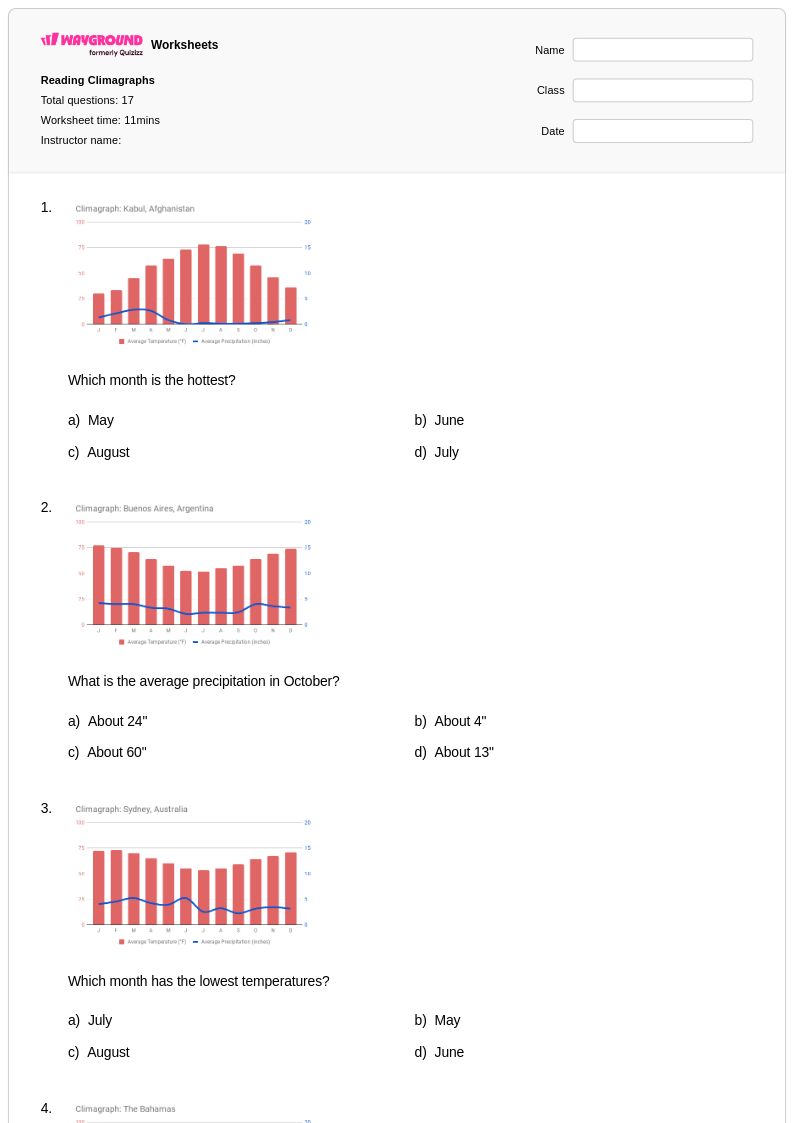
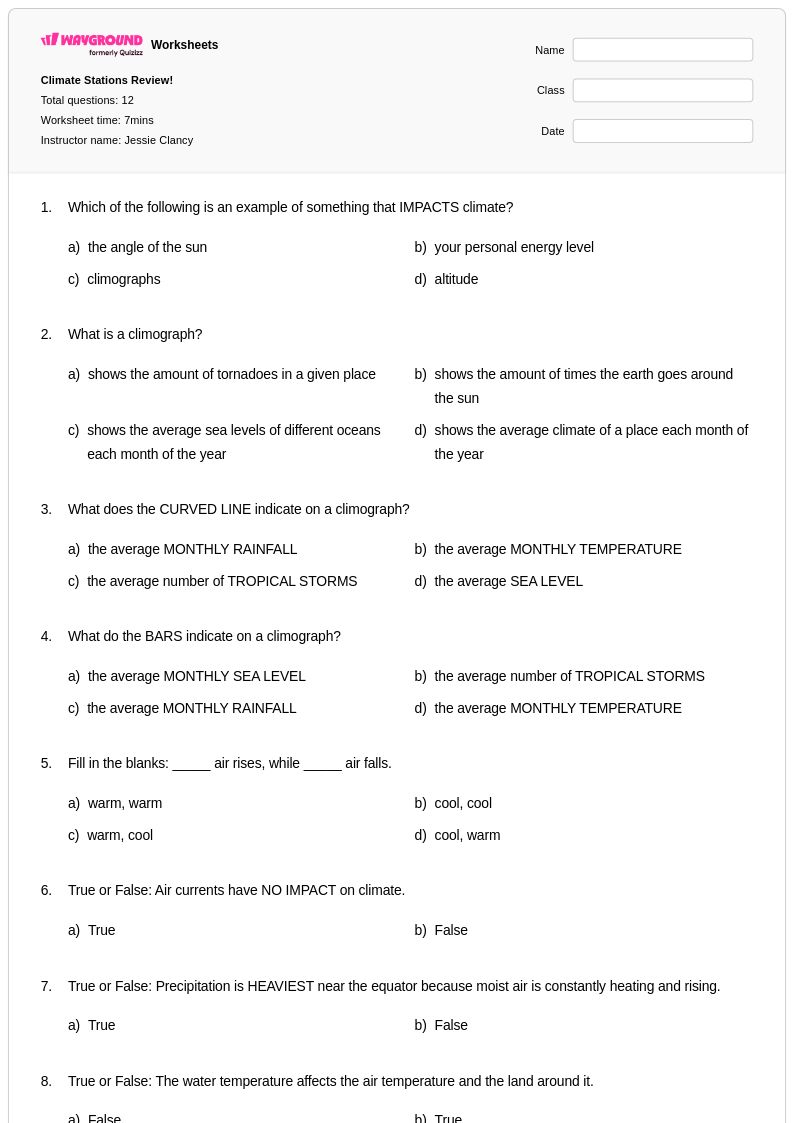
Start by explaining that a climograph displays two types of data simultaneously: temperature is shown as a line graph read against the right vertical axis, while precipitation is displayed as bar graphs read against the left vertical axis. Teach students to read each axis independently before interpreting the relationship between the two. A useful scaffolding strategy is to have students annotate the climograph by labeling the wet season, dry season, warmest month, and coolest month before drawing any conclusions about climate type.
What exercises help students practice interpreting climographs?
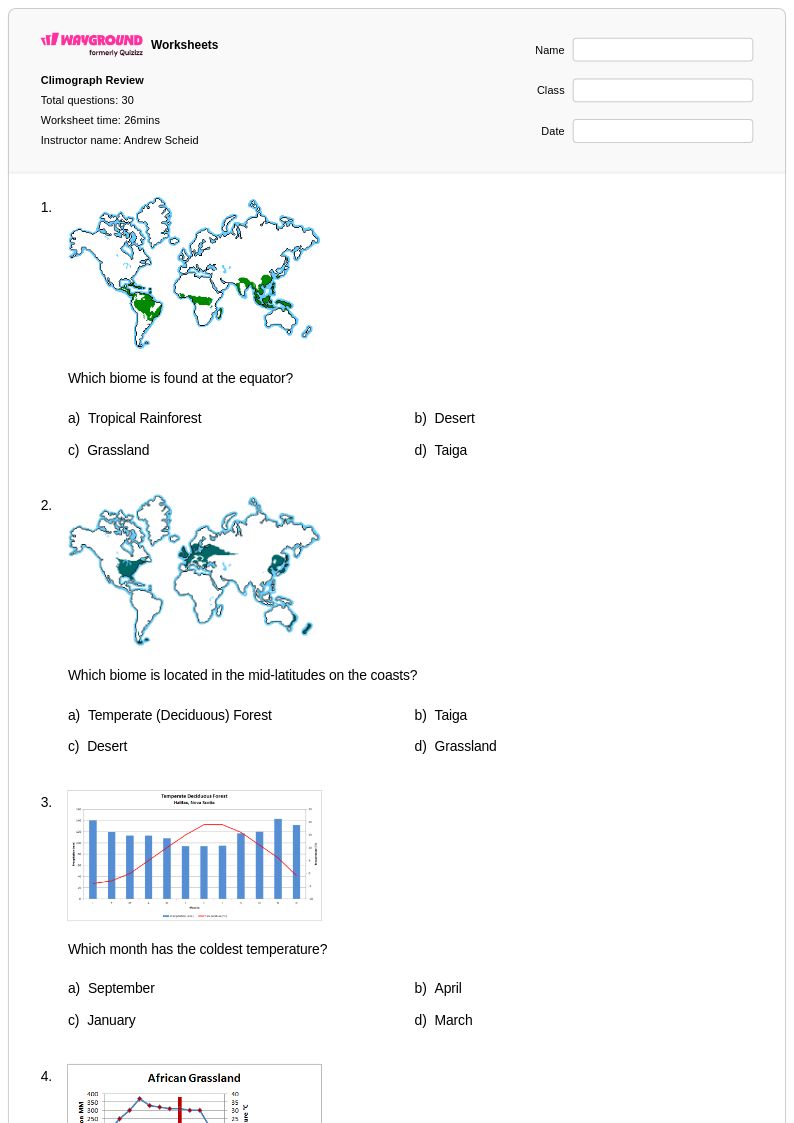
Effective practice exercises include calculating annual average temperature, totaling monthly precipitation to find annual rainfall, and identifying the month with the greatest temperature-precipitation contrast. Comparison activities, where students analyze climographs from two different locations and classify each by climate zone, build both data literacy and geographic reasoning. Worksheets that ask students to match an unlabeled climograph to a world map location are especially effective for reinforcing the connection between climate patterns and geography.
What mistakes do students commonly make when reading climographs?
The most frequent error is confusing which axis applies to temperature versus precipitation, particularly because climographs use a dual-axis format. Students also commonly misread the scale, especially when precipitation values are in millimeters and temperature is in degrees Celsius, leading to incorrect comparisons. A third common mistake is conflating correlation with causation, for example, assuming a location is hot because it receives high rainfall rather than recognizing both are products of its geographic position and climate zone.
How can I use climograph worksheets to differentiate instruction?
For students who need additional support, simplify the task by providing a partially completed climograph with labeled axes and pre-calculated averages, so they can focus on interpretation rather than computation. For advanced students, extend the challenge by asking them to predict vegetation type, identify the Köppen climate classification, or compare the climograph to a second location. On Wayground, teachers can apply accommodations such as reduced answer choices or read-aloud settings to individual students without affecting the rest of the class.
How do I use Wayground's climograph worksheets in my classroom?
Wayground's climograph worksheets are available as printable PDFs for traditional classroom use and in digital formats for technology-integrated learning environments, including the option to host them as an interactive quiz directly on the platform. Each worksheet includes a complete answer key, making them practical for independent practice, homework, or formative assessment without additional preparation. Teachers can filter resources by skill focus, such as data interpretation or climate classification, to find materials that fit their specific lesson goals.
How does analyzing climographs fit into a broader geography curriculum?
Climograph analysis sits at the intersection of physical geography, data literacy, and Earth science, making it a high-value skill that connects to multiple content areas. Students who can read climographs are better prepared to understand biome distribution, agricultural patterns, and the geographic factors that shape human settlement. Integrating climograph practice into a unit on climate zones reinforces how location, elevation, and proximity to water influence regional weather patterns over time.