20 Q
3rd - Uni
15 Q
5th - Uni
20 Q
4th - Uni
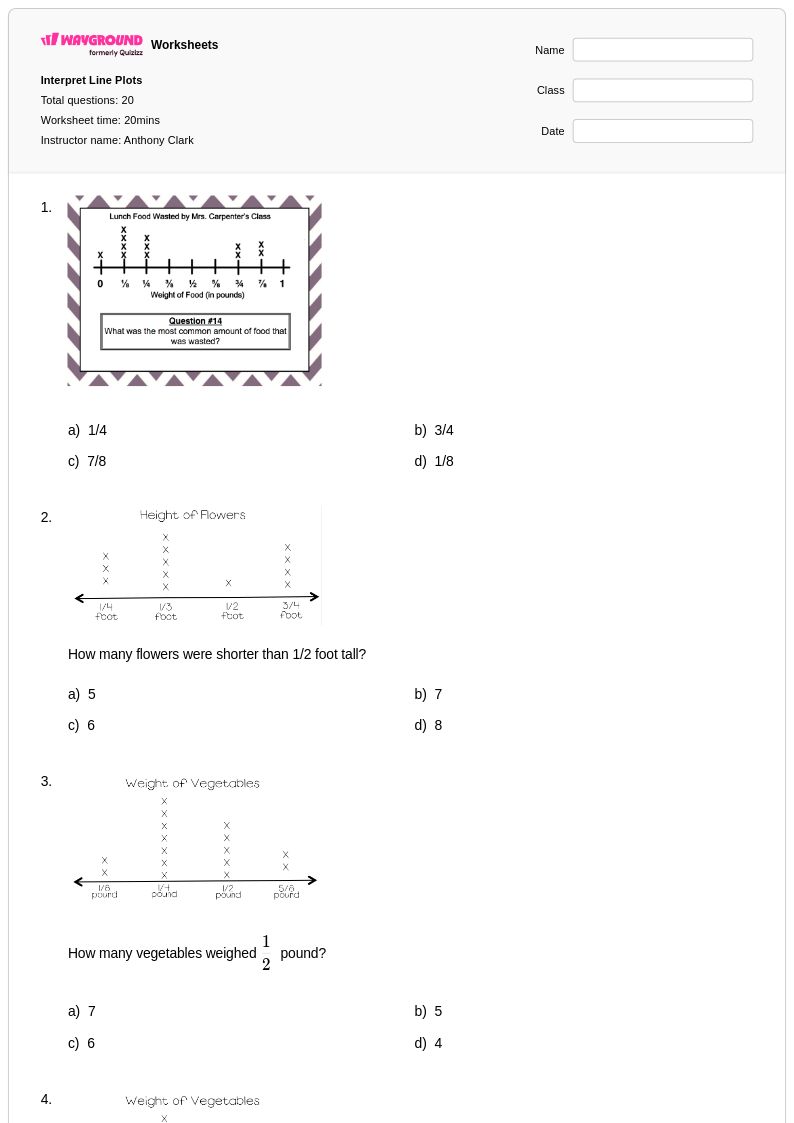
20 Q
5th - Uni

20 Q
5th - Uni
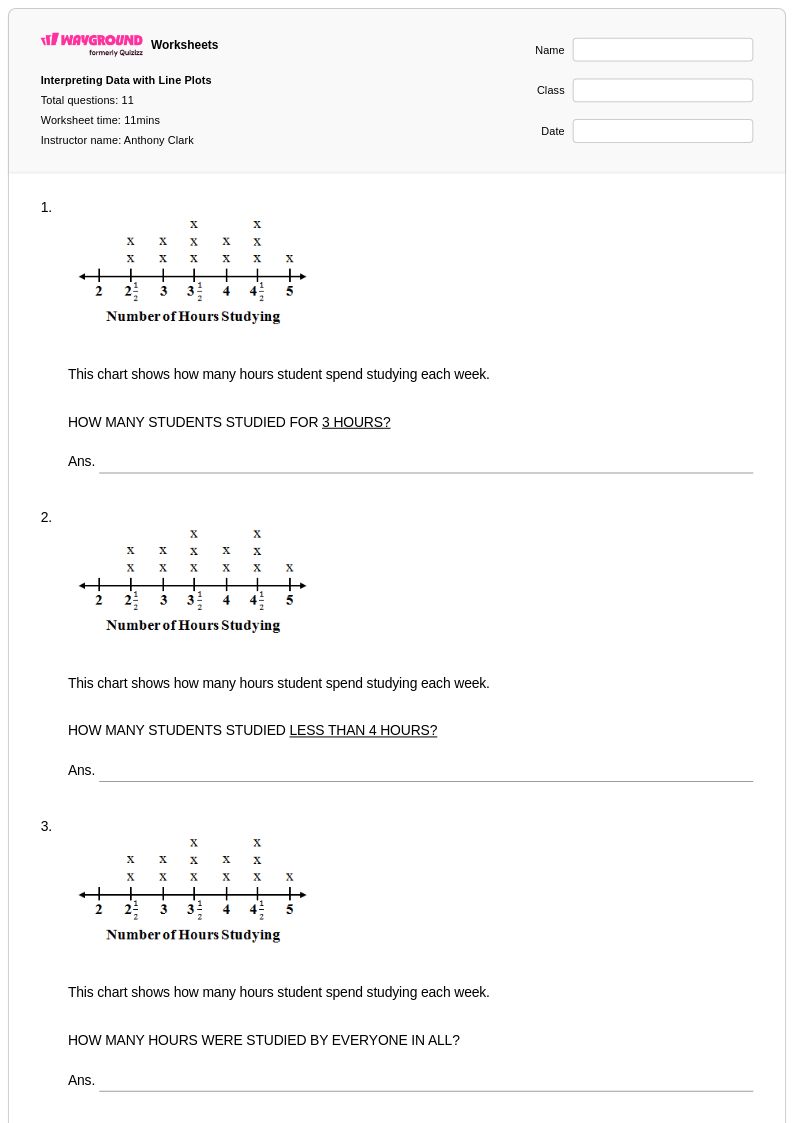
11 Q
5th - Uni
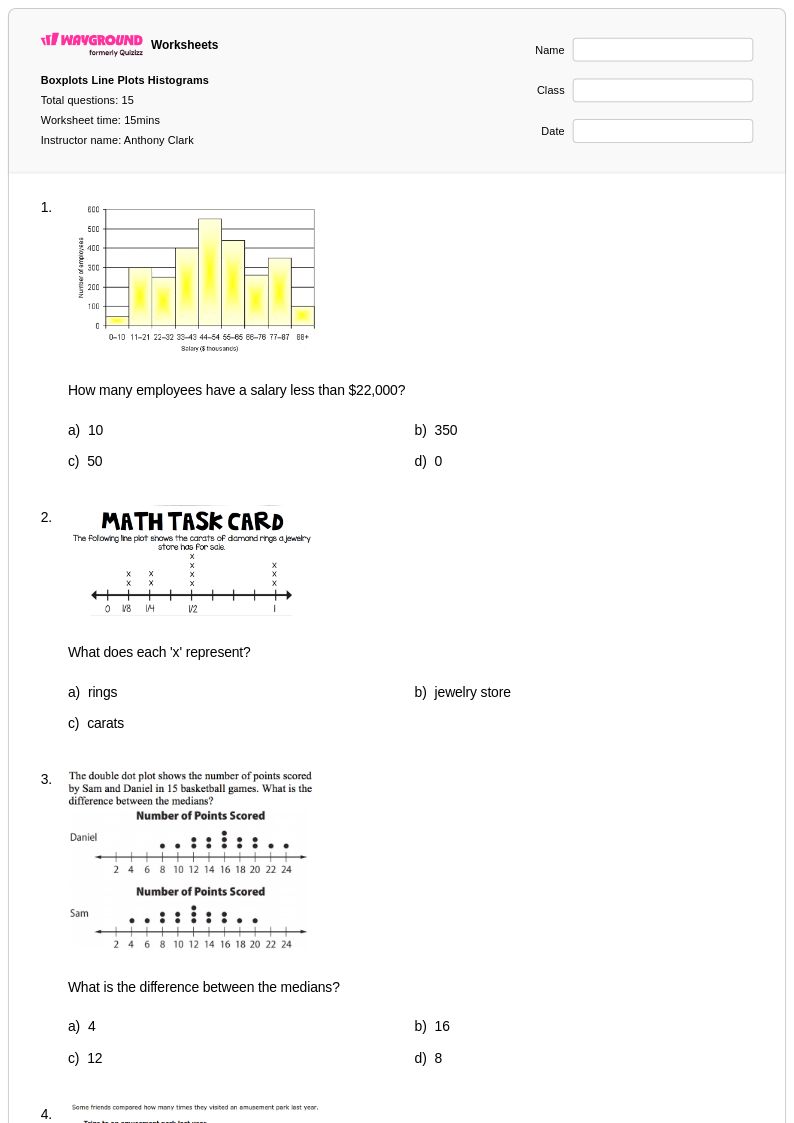
15 Q
6th - Uni
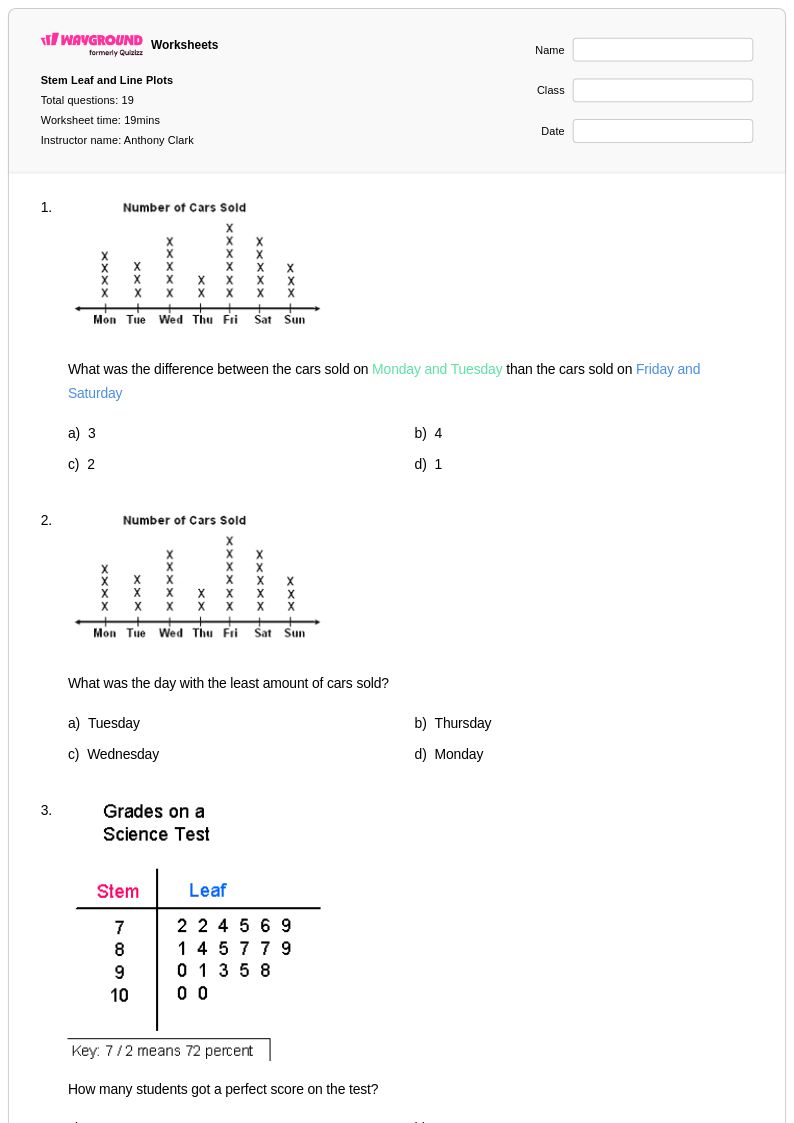
19 Q
5th - Uni
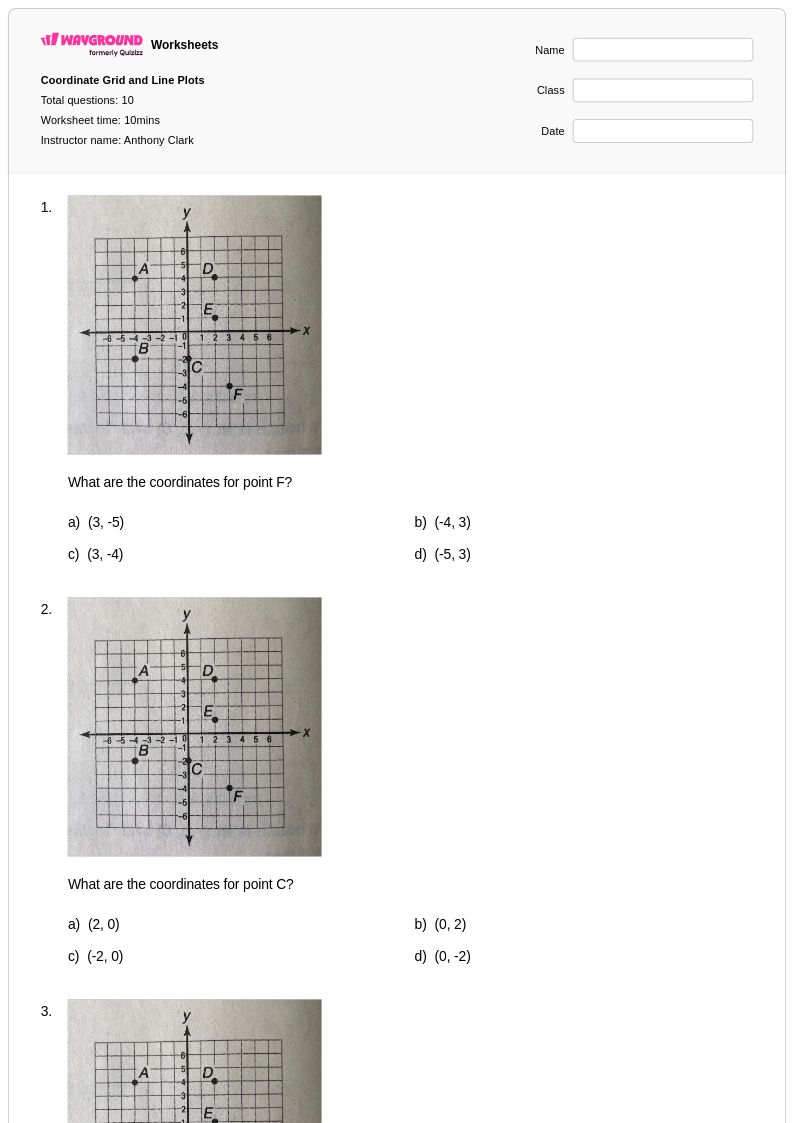
10 Q
5th - Uni
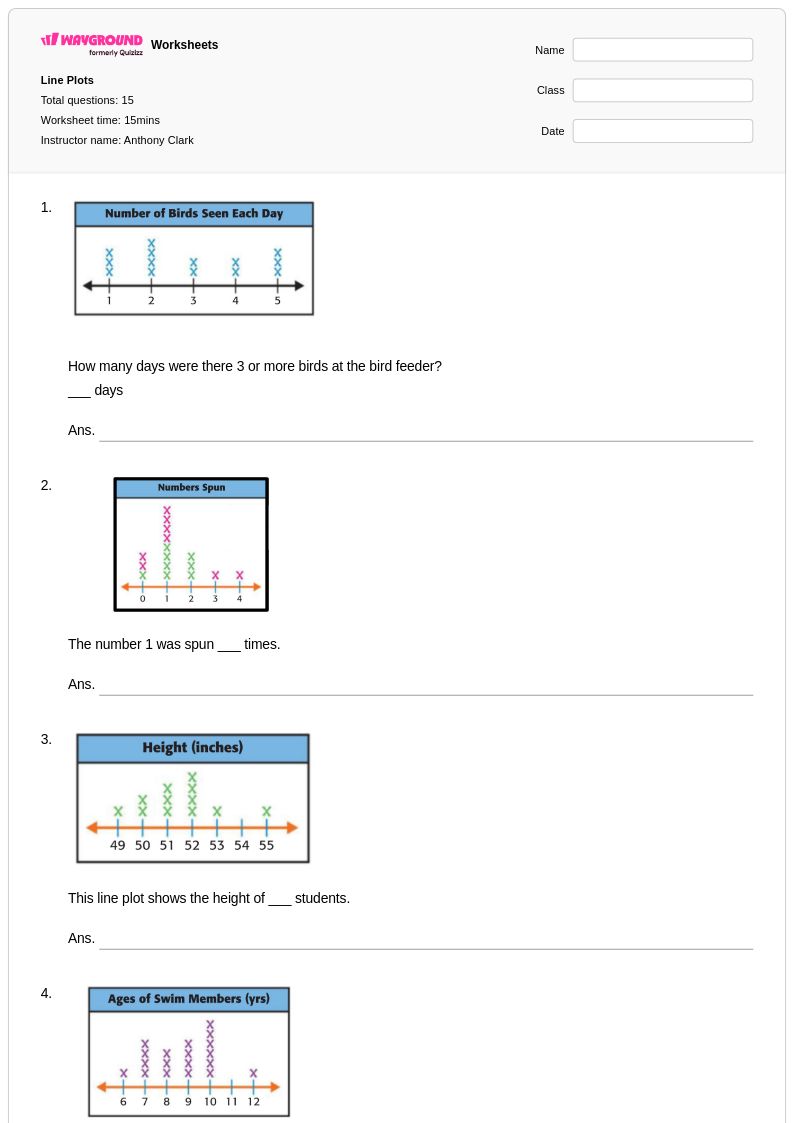
15 Q
3rd - Uni
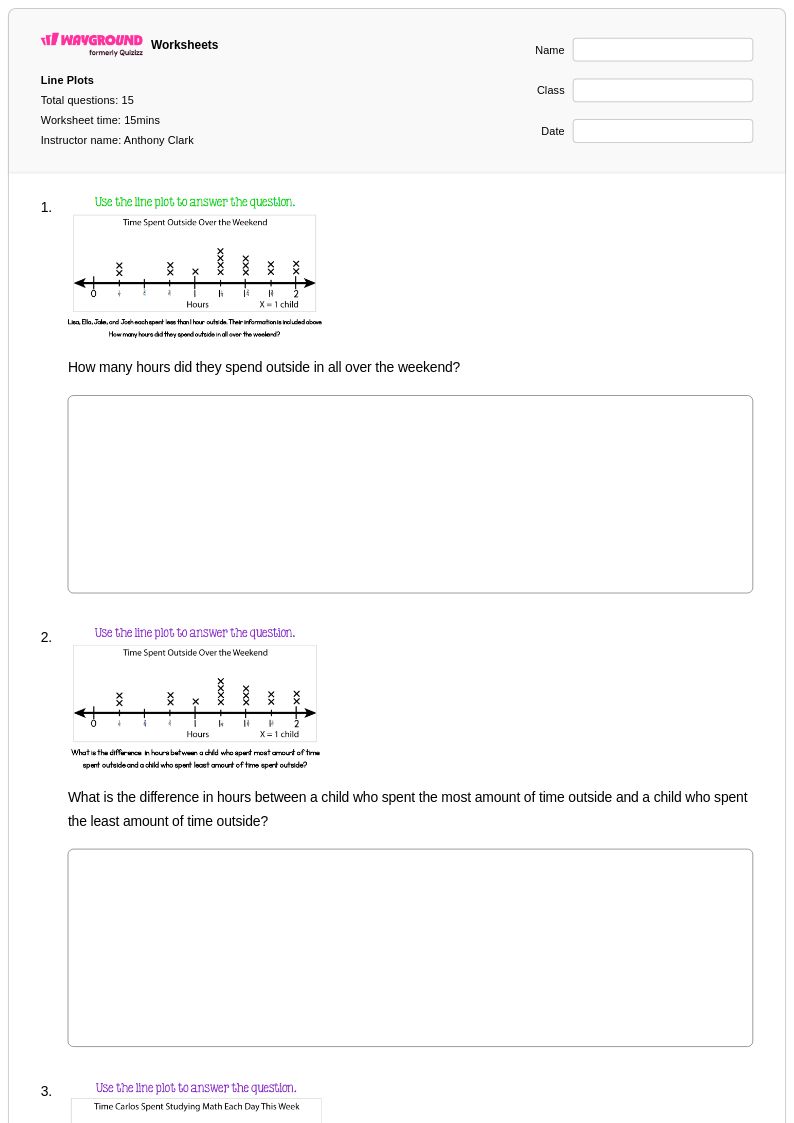
15 Q
2nd - Uni
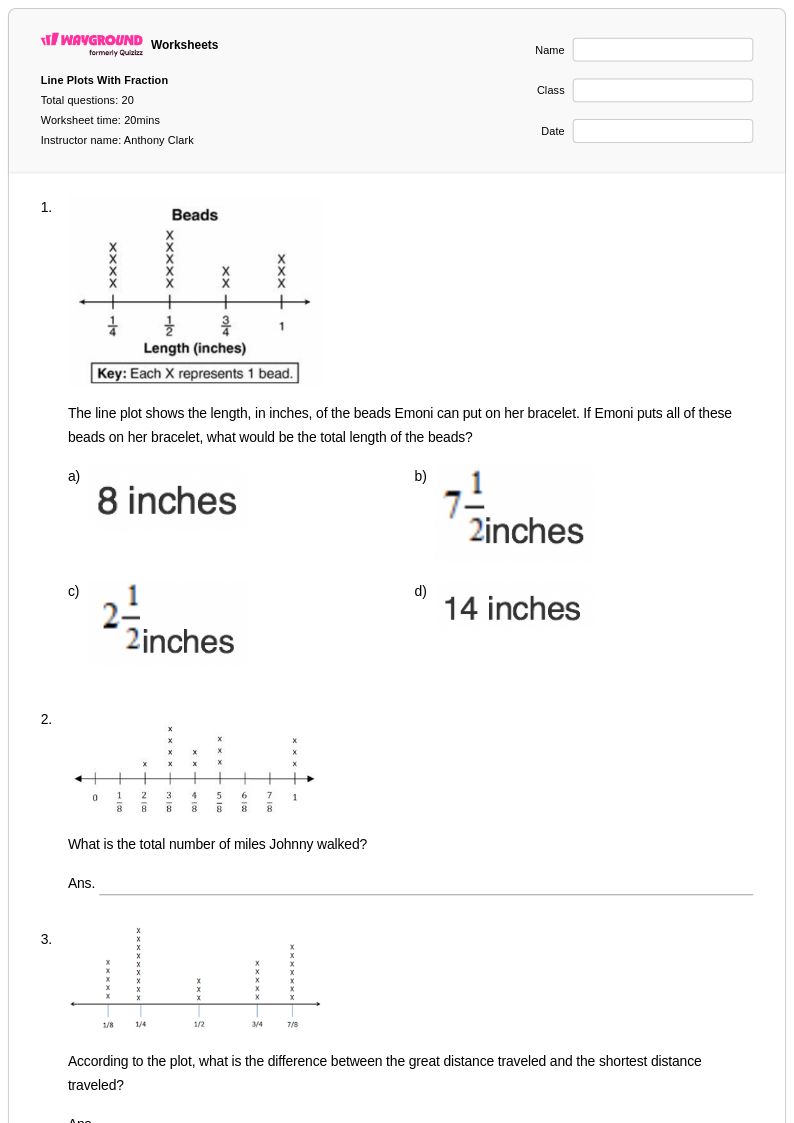
20 Q
4th - Uni

12 Q
7th
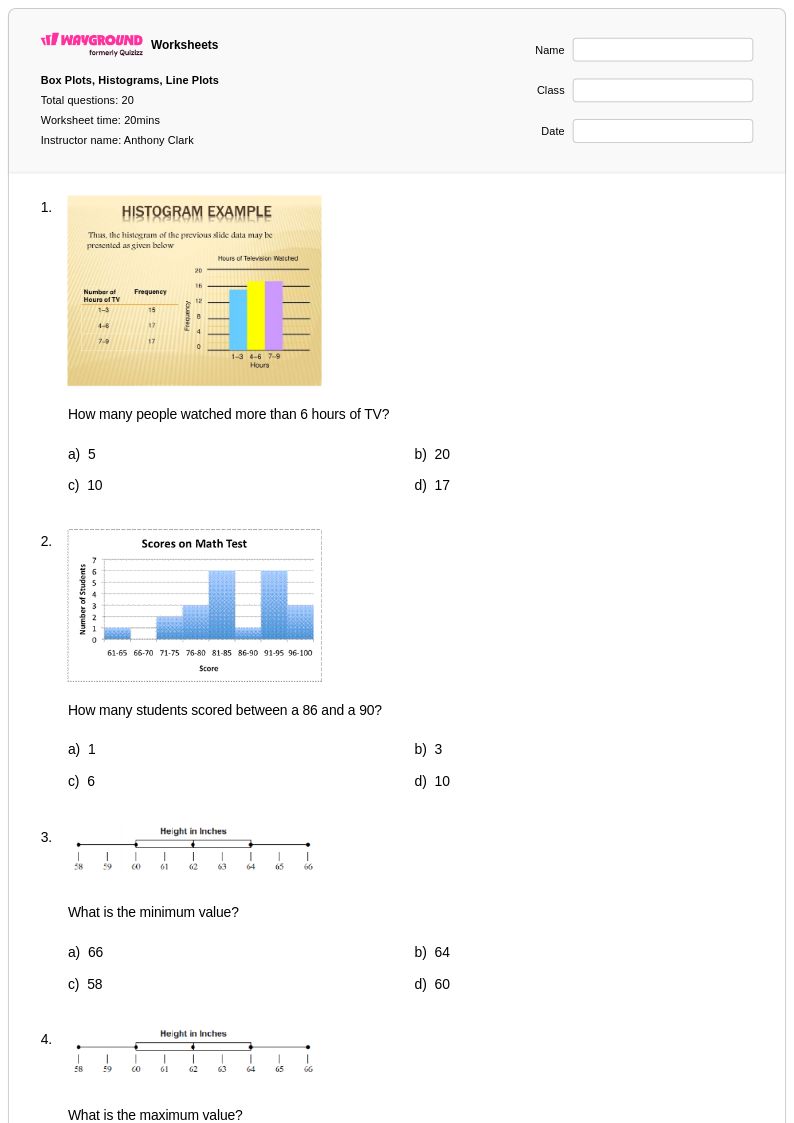
20 Q
6th - Uni
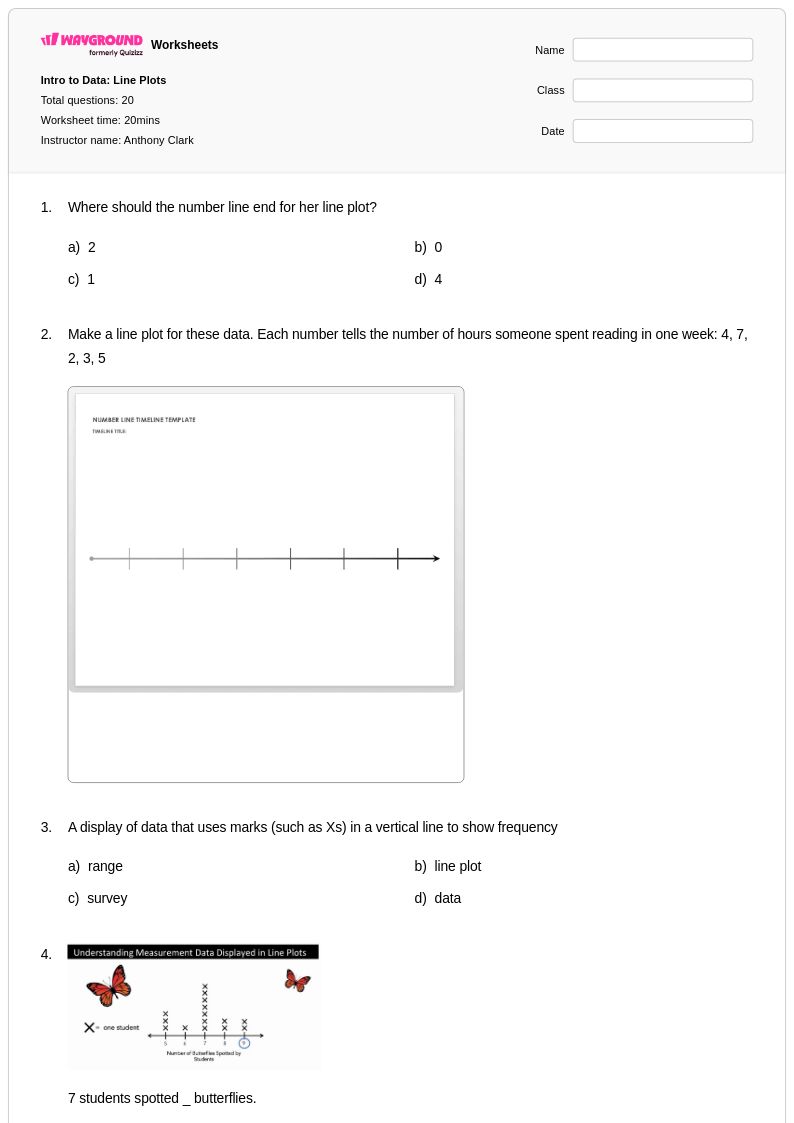
20 Q
2nd - Uni
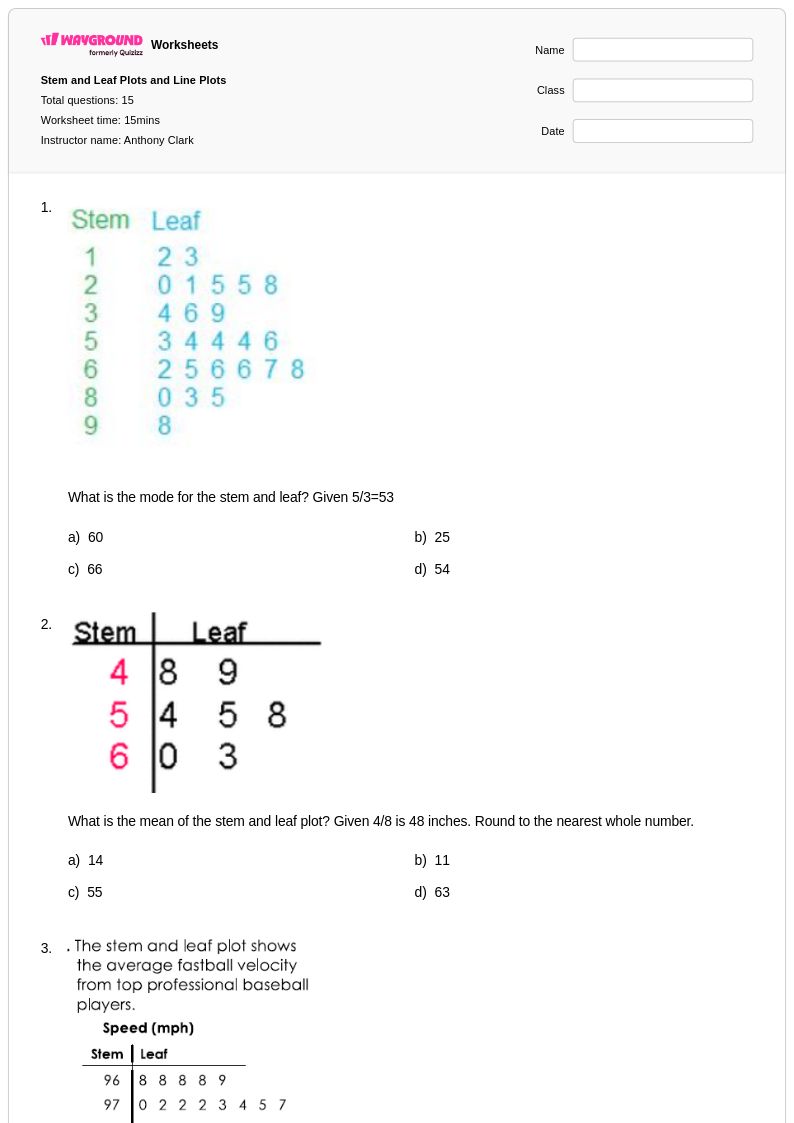
15 Q
5th - Uni
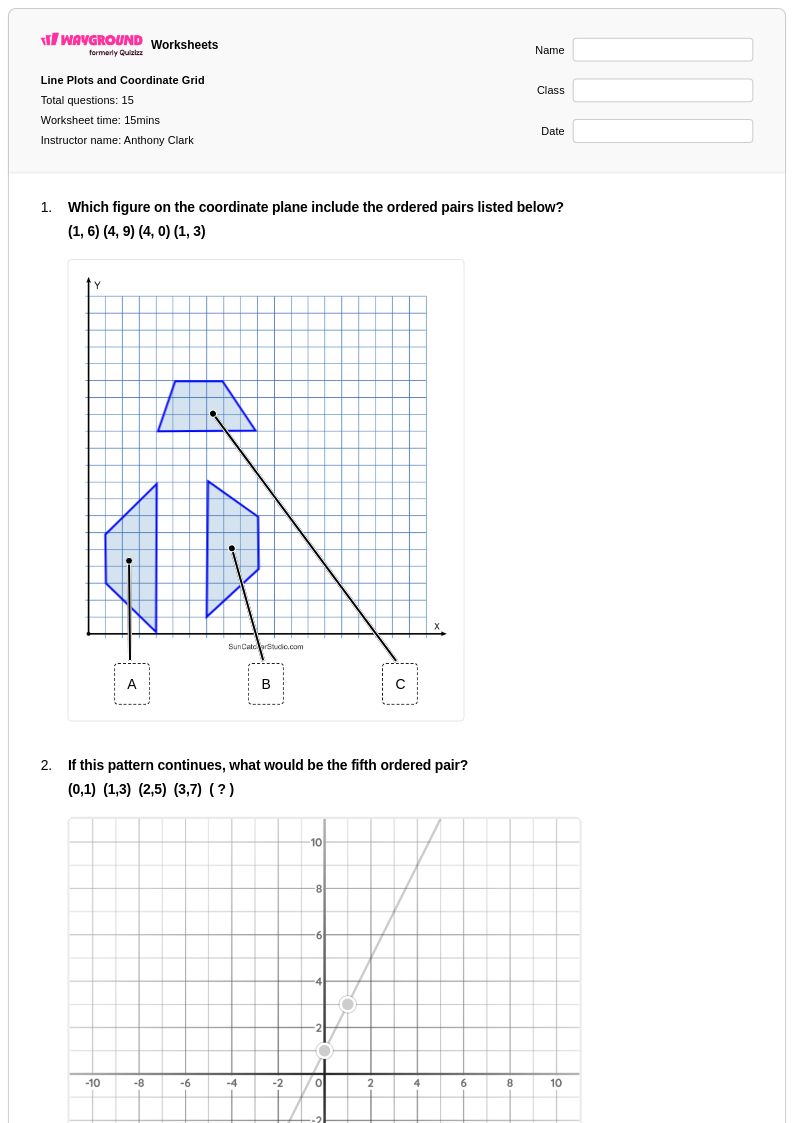
15 Q
5th - Uni
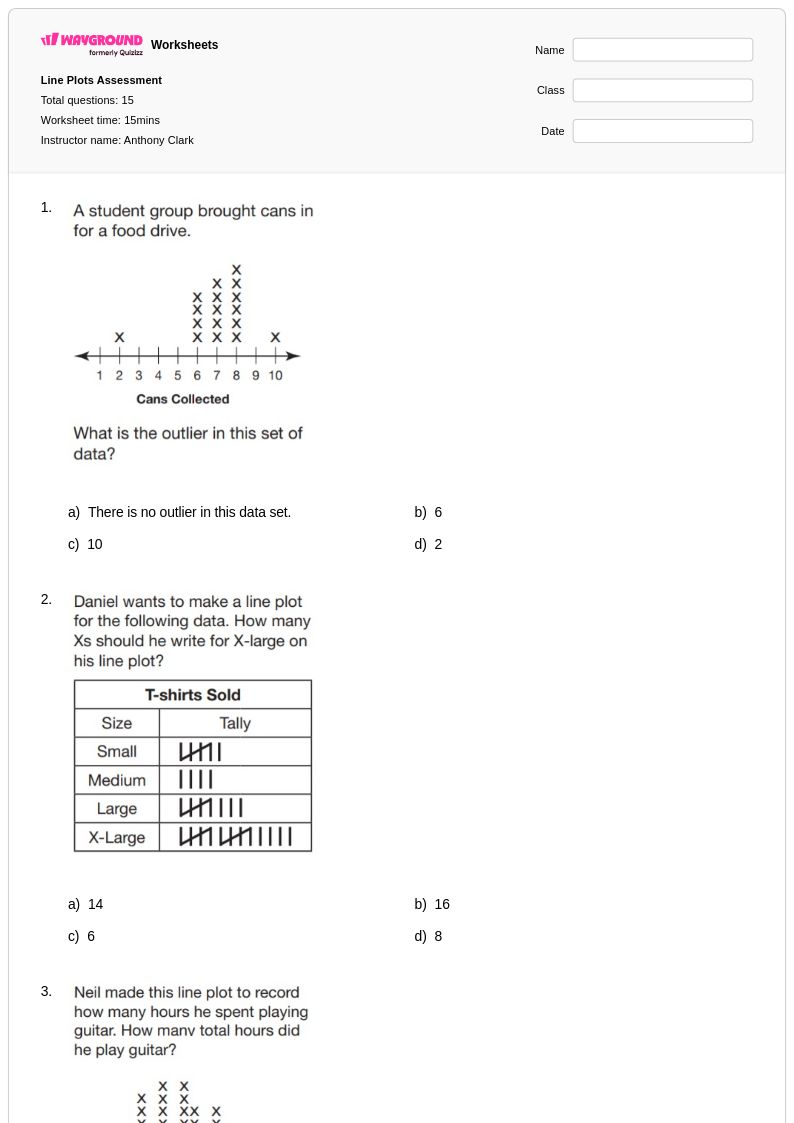
15 Q
5th - Uni
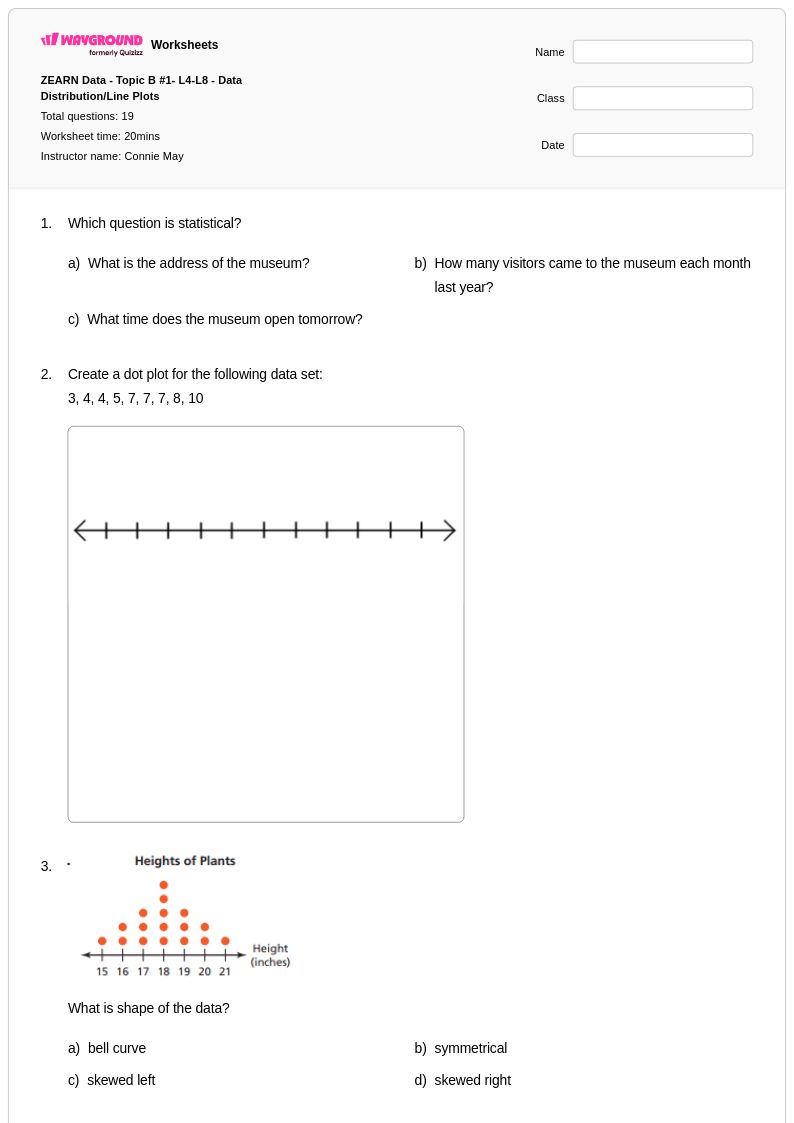
19 Q
6th - 8th
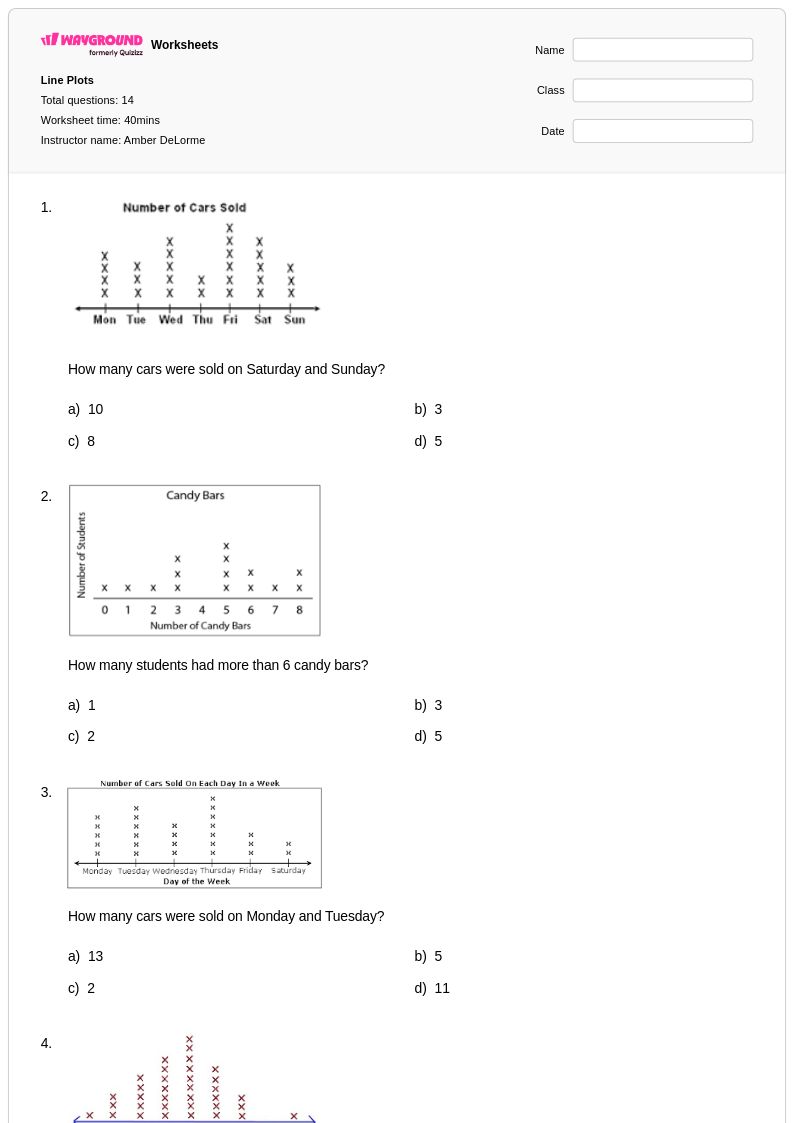
14 Q
7th
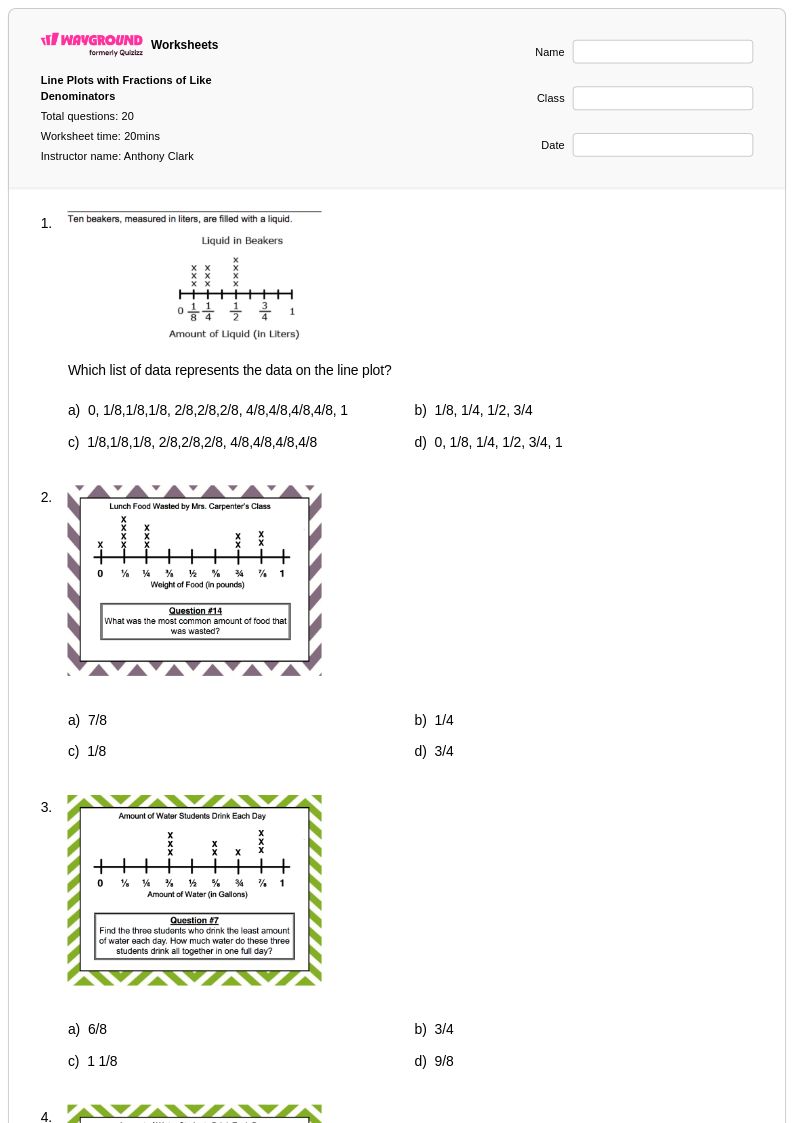
20 Q
4th - Uni
15 Q
5th - Uni
20 Q
3rd - Uni
20 Q
4th - Uni
Explore Other Subject Worksheets for year 7
Explore printable Line Plots worksheets for Year 7
Line plots serve as a fundamental data visualization tool for Year 7 mathematics students, helping them develop critical skills in organizing, displaying, and interpreting numerical information. Wayground's extensive collection of line plot worksheets provides comprehensive practice opportunities that strengthen students' ability to construct accurate plots using number lines, analyze data distribution patterns, and draw meaningful conclusions from graphical representations. These carefully designed practice problems guide students through essential concepts such as plotting fractional measurements, identifying clusters and gaps in data sets, and calculating measures of central tendency directly from line plots. Each worksheet includes a detailed answer key and is available as a free printable pdf, making it easy for educators to provide targeted skill reinforcement both in classroom settings and for independent study.
Wayground, formerly Quizizz, empowers educators with millions of teacher-created line plot resources that can be easily accessed through robust search and filtering capabilities aligned to state mathematics standards. The platform's differentiation tools allow teachers to customize worksheets based on individual student needs, whether providing foundational support for struggling learners or offering enrichment challenges for advanced students. These flexible resources are available in both printable pdf format and interactive digital versions, enabling seamless integration into diverse instructional approaches from traditional paper-based assignments to technology-enhanced learning environments. Teachers can efficiently plan comprehensive lesson sequences, implement targeted remediation strategies, and provide ongoing skill practice that builds students' confidence in data analysis and graphical interpretation throughout their Year 7 mathematics journey.
FAQs
How should I teach line plots to 7th graders?
What exercises help 7th graders practice line plots?
What mistakes do students commonly make with line plots?
How can I use a Wayground line plot worksheet in class?
How do line plots fit into the Grade 7 Common Core math progression?
How can I differentiate a Grade 7 line plot worksheet?
What grade level are these line plot worksheets for?