
20 Q
8th - Uni
19 Q
7th - 12th
40 Q
9th - 12th
15 Q
8th - Uni
20 Q
8th - Uni
15 Q
7th - 10th
20 Q
9th - Uni
15 Q
8th - Uni
9 Q
7th - 12th
20 Q
9th - 11th
13 Q
8th - Uni
20 Q
9th - 11th
15 Q
8th - Uni
20 Q
8th - Uni
20 Q
8th - Uni
10 Q
8th - Uni
20 Q
8th - Uni
18 Q
9th - 12th
20 Q
9th - 12th
13 Q
9th - Uni
20 Q
9th - Uni
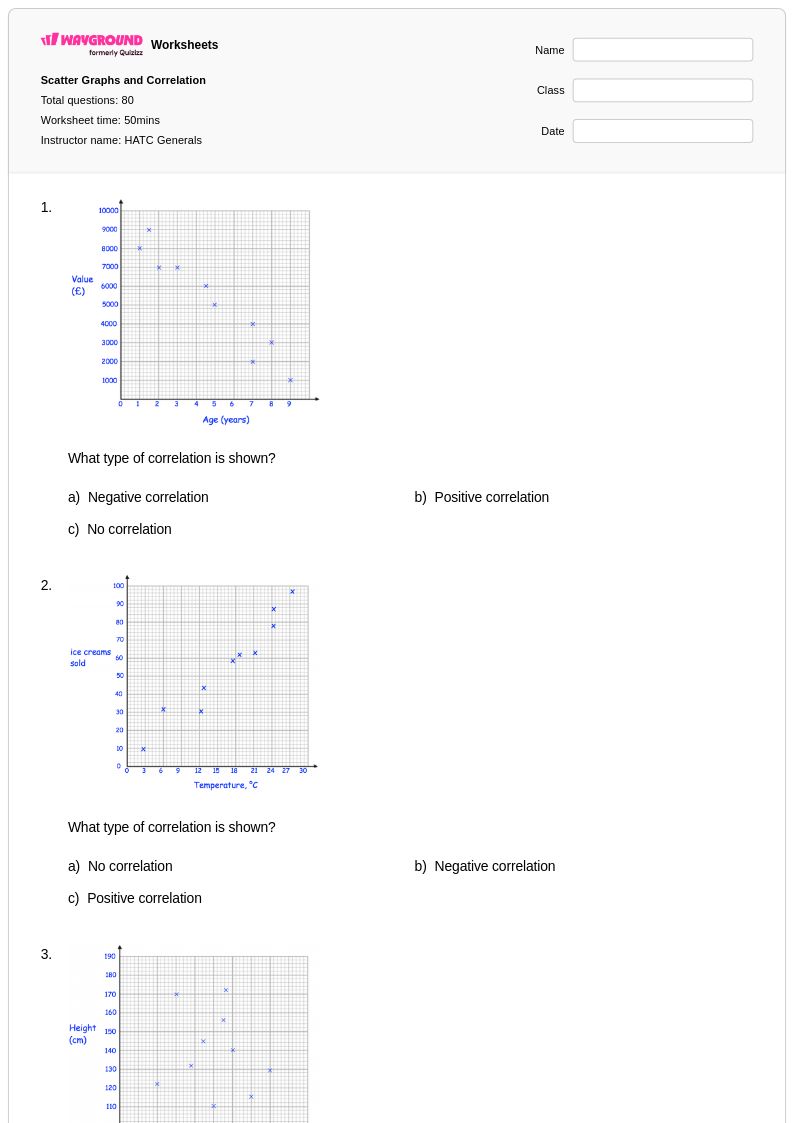
80 Q
9th - 12th
20 Q
8th - Uni
20 Q
9th - 12th
Explore Other Subject Worksheets for year 10
Explore printable Scatter Plot Correlation worksheets for Year 10
Scatter plot correlation worksheets for Year 10 mathematics provide students with essential practice in analyzing the relationships between two quantitative variables through visual data representation. These comprehensive worksheets available through Wayground (formerly Quizizz) focus on developing critical statistical thinking skills, including identifying positive, negative, and no correlation patterns, calculating correlation coefficients, and interpreting the strength of linear relationships. Students work through carefully structured practice problems that reinforce their understanding of how data points cluster and trend on coordinate planes, while building proficiency in distinguishing between correlation and causation. Each worksheet includes detailed answer keys and is available as free printable pdf resources, allowing educators to seamlessly integrate meaningful data analysis activities into their curriculum while supporting students' mastery of this fundamental statistical concept.
Wayground (formerly Quizizz) empowers mathematics teachers with an extensive collection of millions of teacher-created scatter plot correlation resources, featuring robust search and filtering capabilities that align with state and national mathematics standards. The platform's differentiation tools enable educators to customize worksheet difficulty levels and problem types to meet diverse learning needs, while flexible formatting options provide both printable pdf versions and interactive digital alternatives for varied classroom environments. These comprehensive resources support effective lesson planning by offering ready-to-use materials for initial instruction, targeted skill practice, and assessment preparation, while also providing valuable tools for remediation and enrichment activities that help students develop deeper conceptual understanding of statistical relationships and data interpretation skills essential for advanced mathematics coursework.