
12 Q
10th
6 Q
9th - 12th
20 Q
9th - Uni
15 Q
9th - Uni
13 Q
10th - 12th
12 Q
6th - Uni
25 Q
KG - Uni
11 Q
6th - 10th
25 Q
9th - 12th
14 Q
9th - 12th
10 Q
10th - Uni
18 Q
9th - 12th
12 Q
9th - 12th
15 Q
9th - 10th
20 Q
7th - Uni
14 Q
7th - Uni
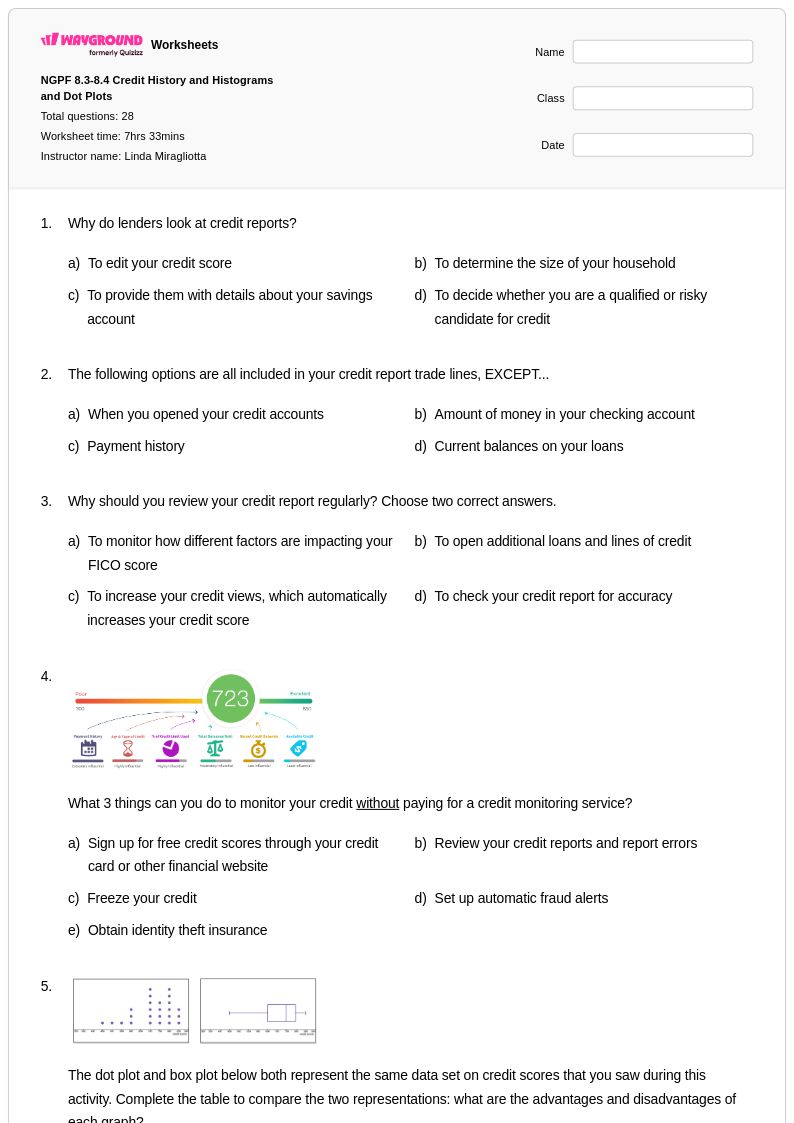
28 Q
9th - 12th
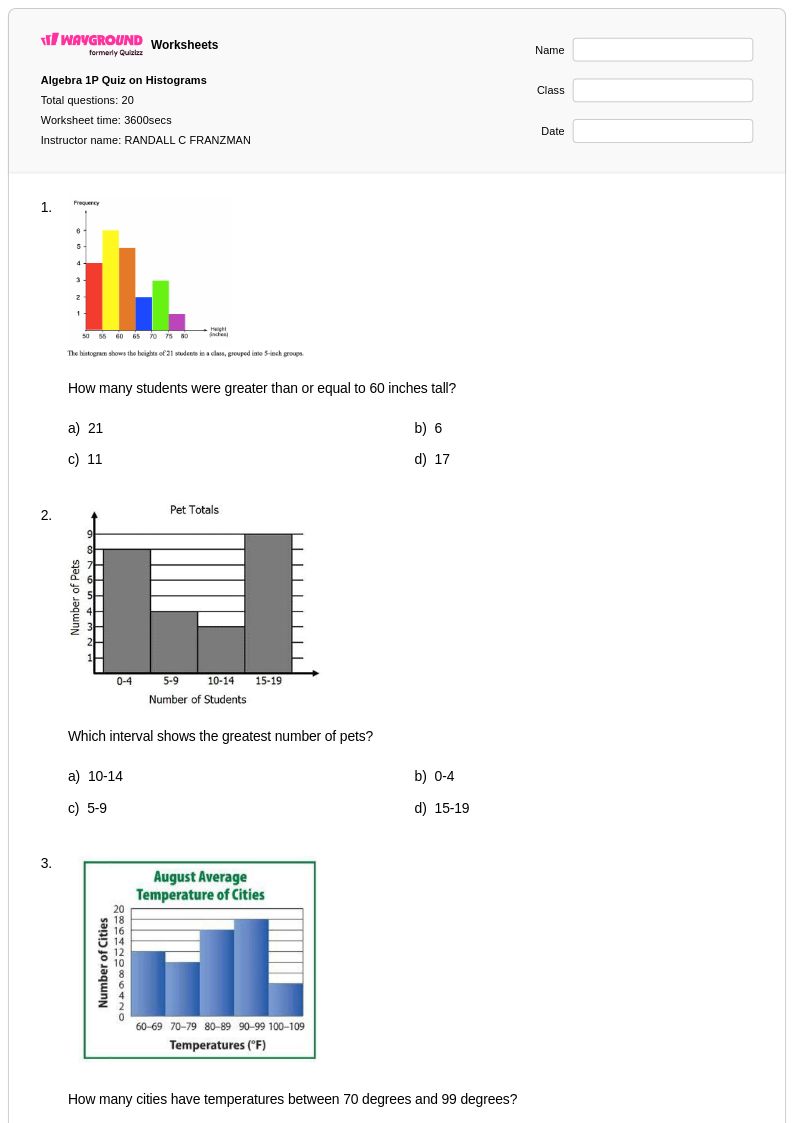
20 Q
9th - 12th
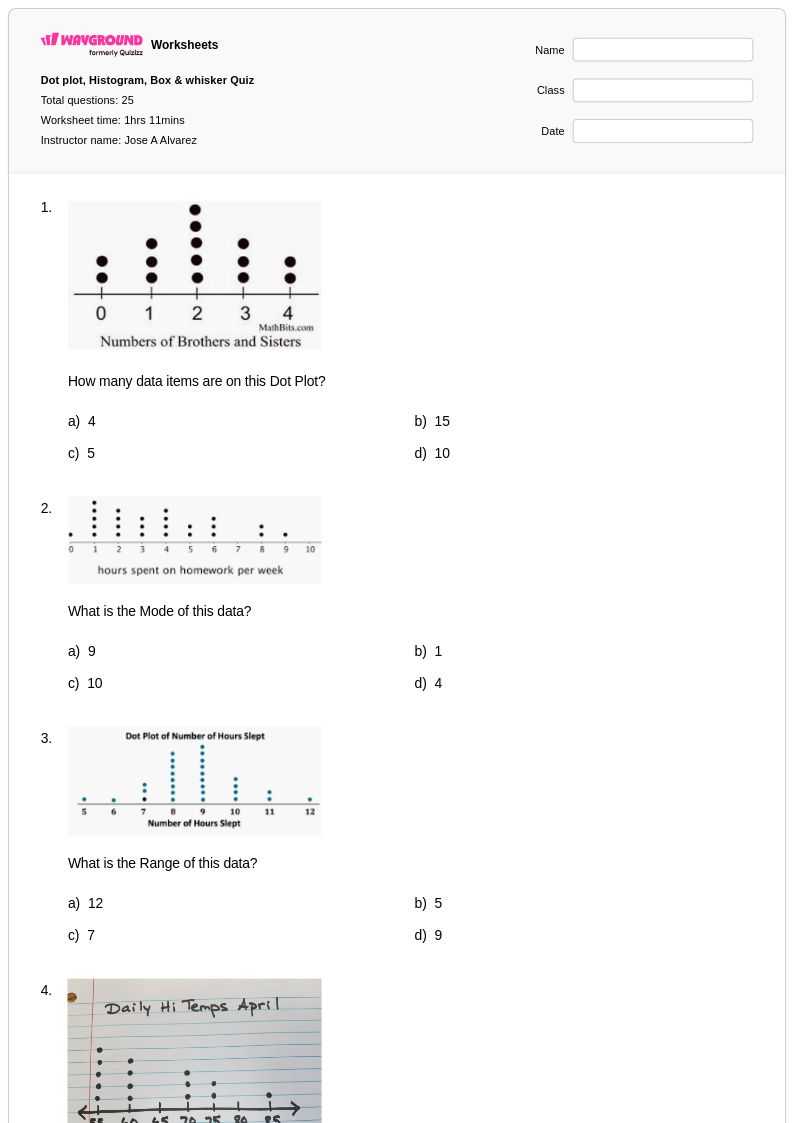
25 Q
9th - 12th
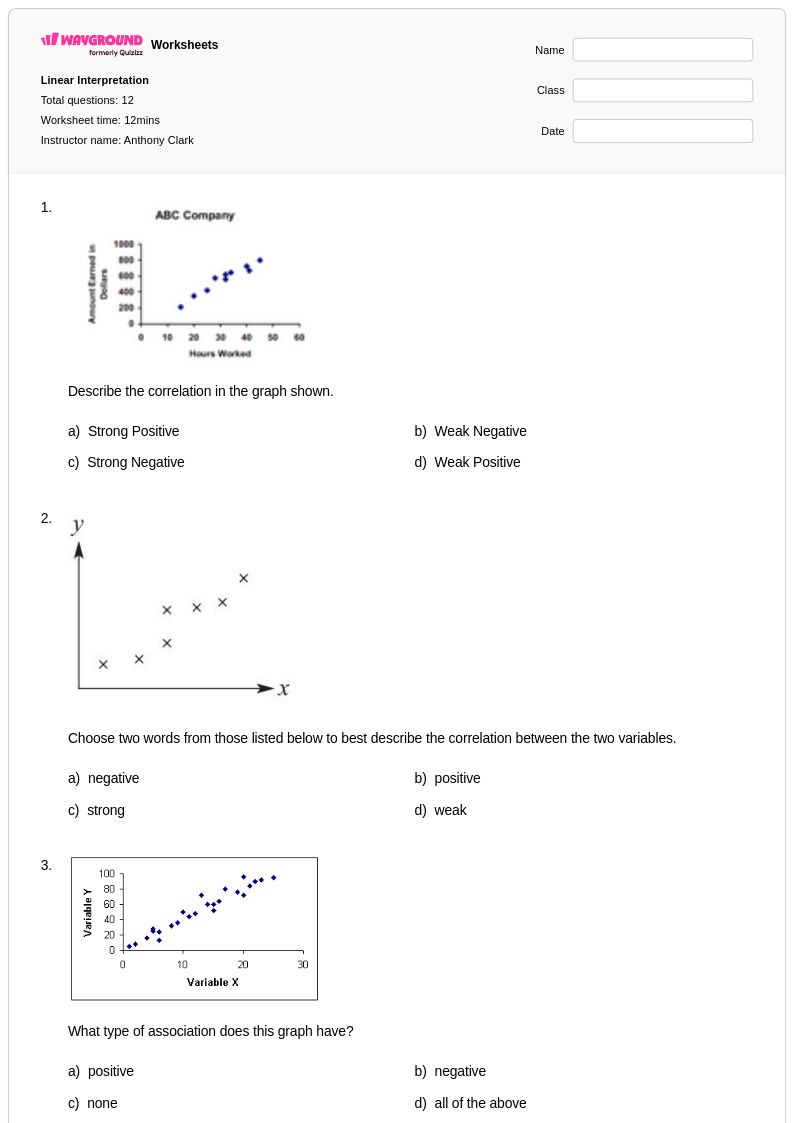
12 Q
9th - Uni
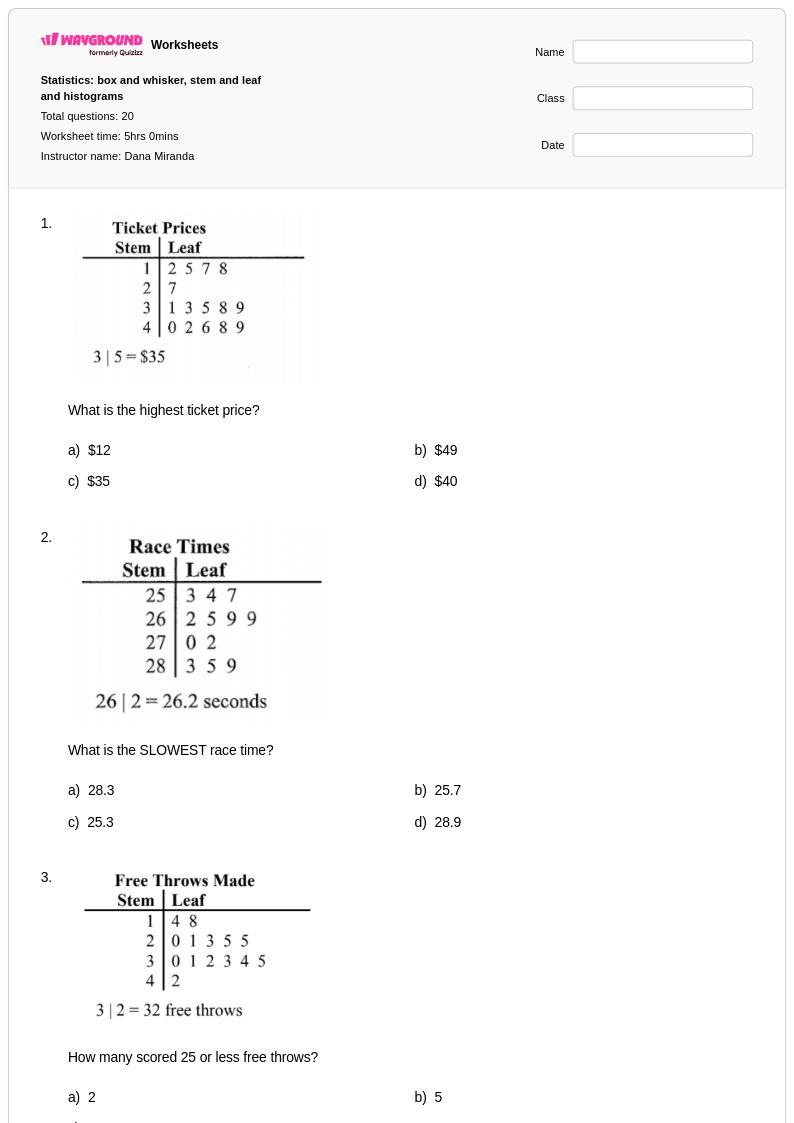
20 Q
10th
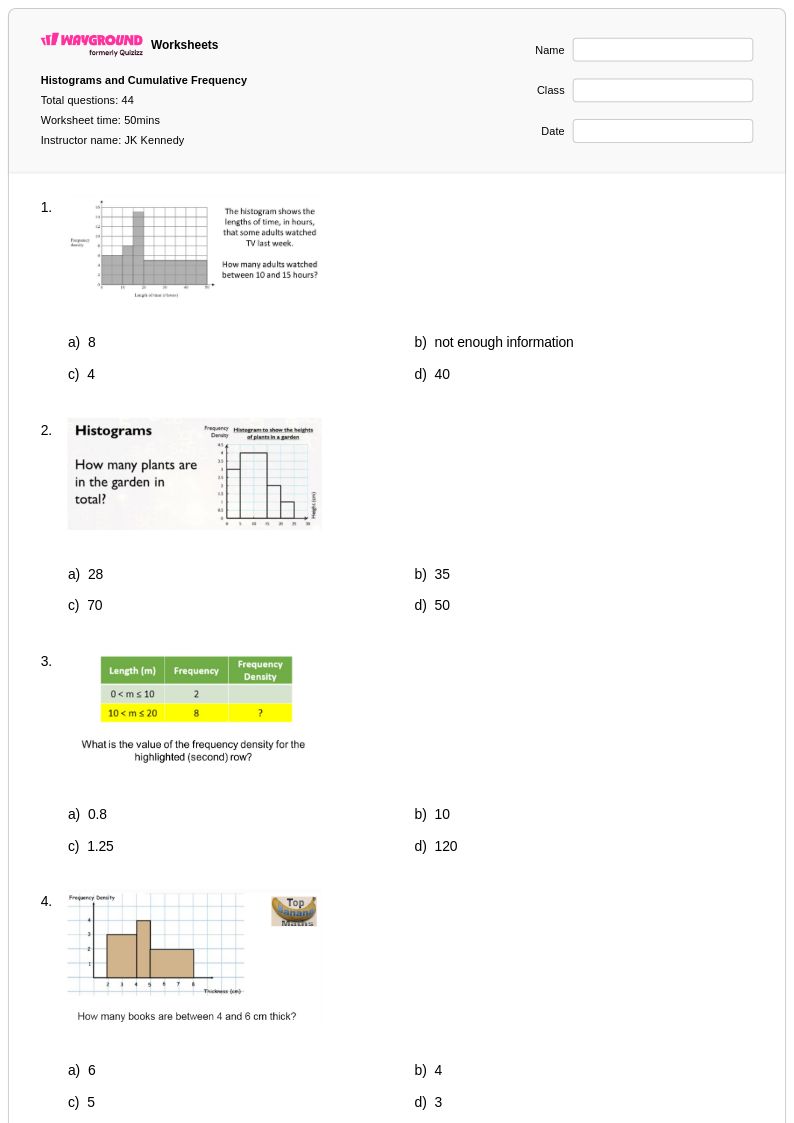
44 Q
10th
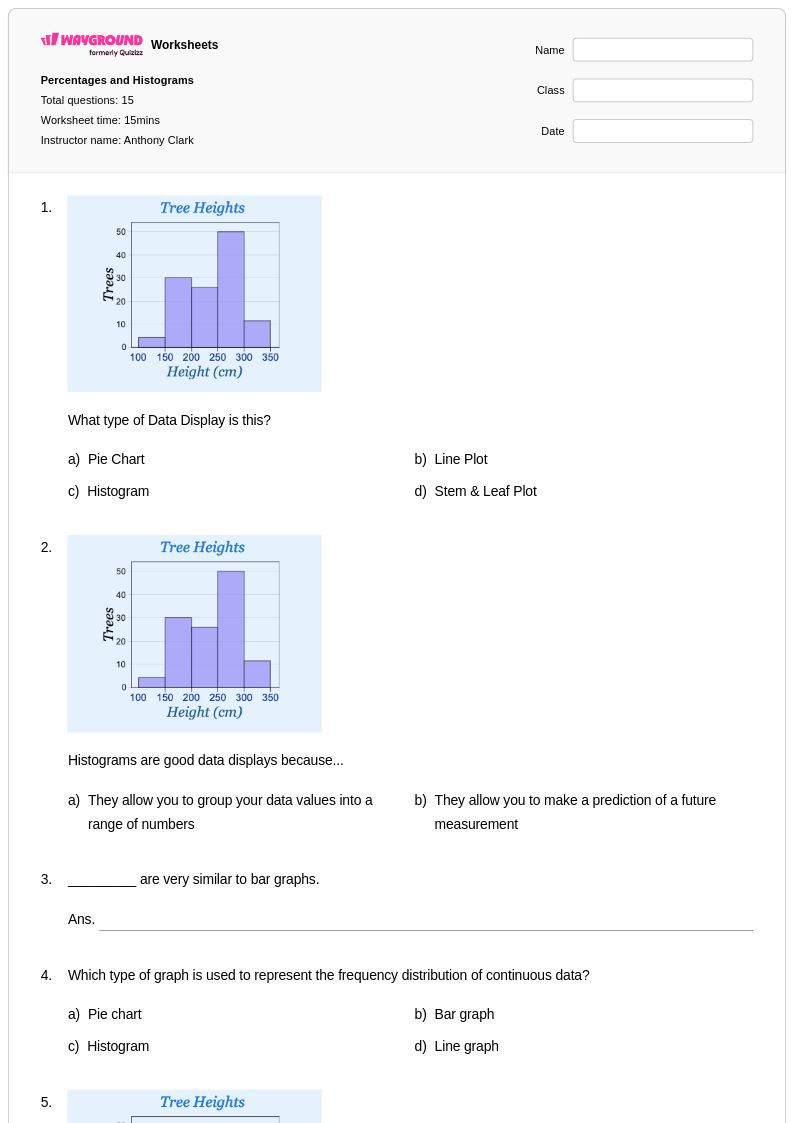
15 Q
9th - Uni
16 Q
9th - 12th
Explore Other Subject Worksheets for year 10
Explore printable Histogram Interpretation worksheets for Year 10
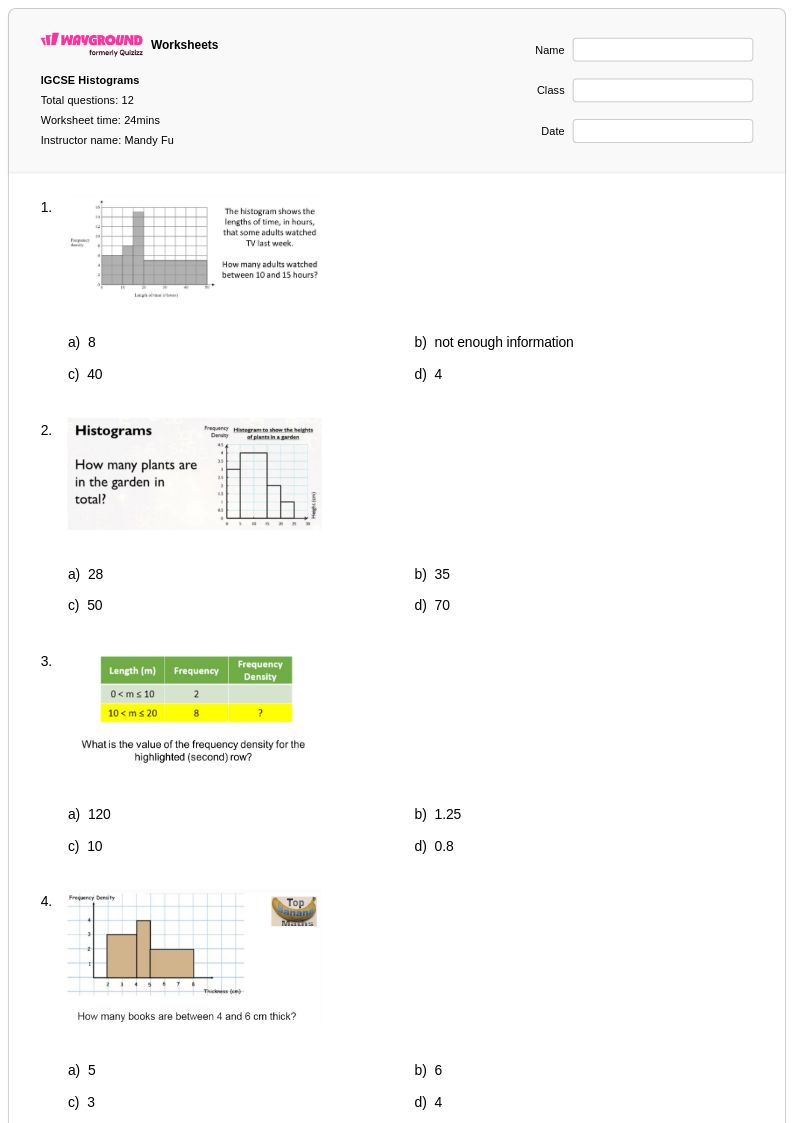
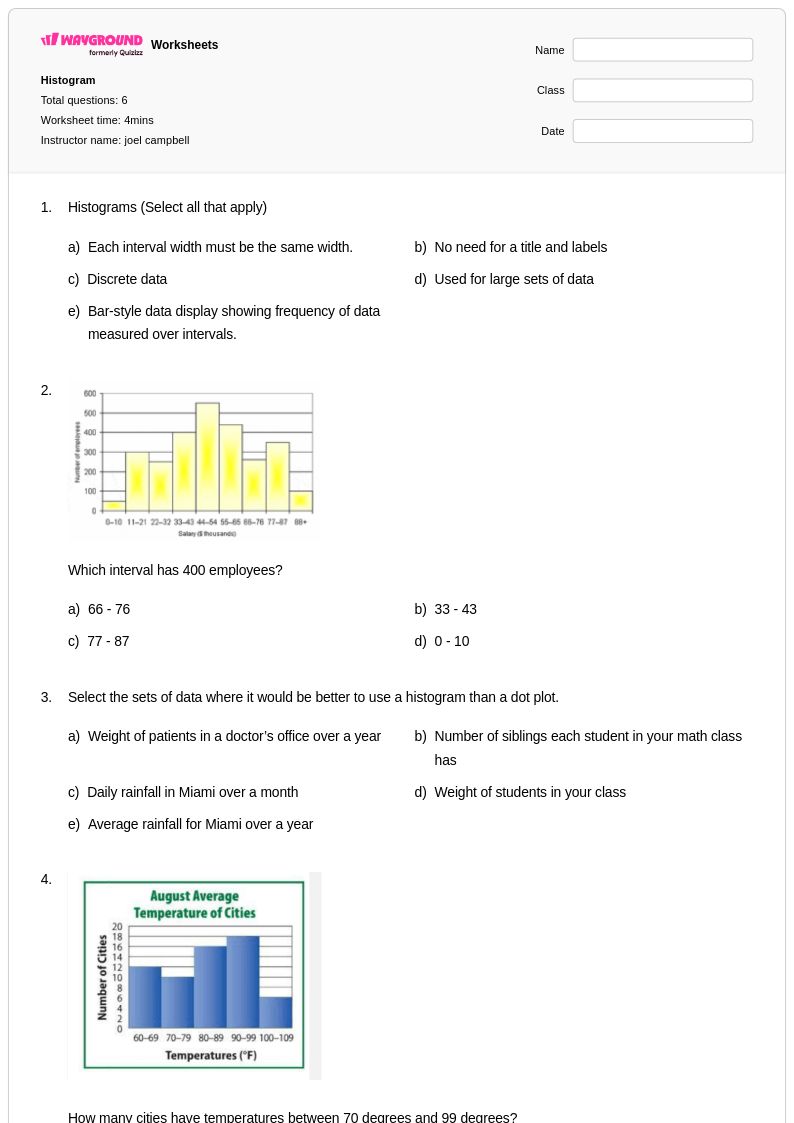
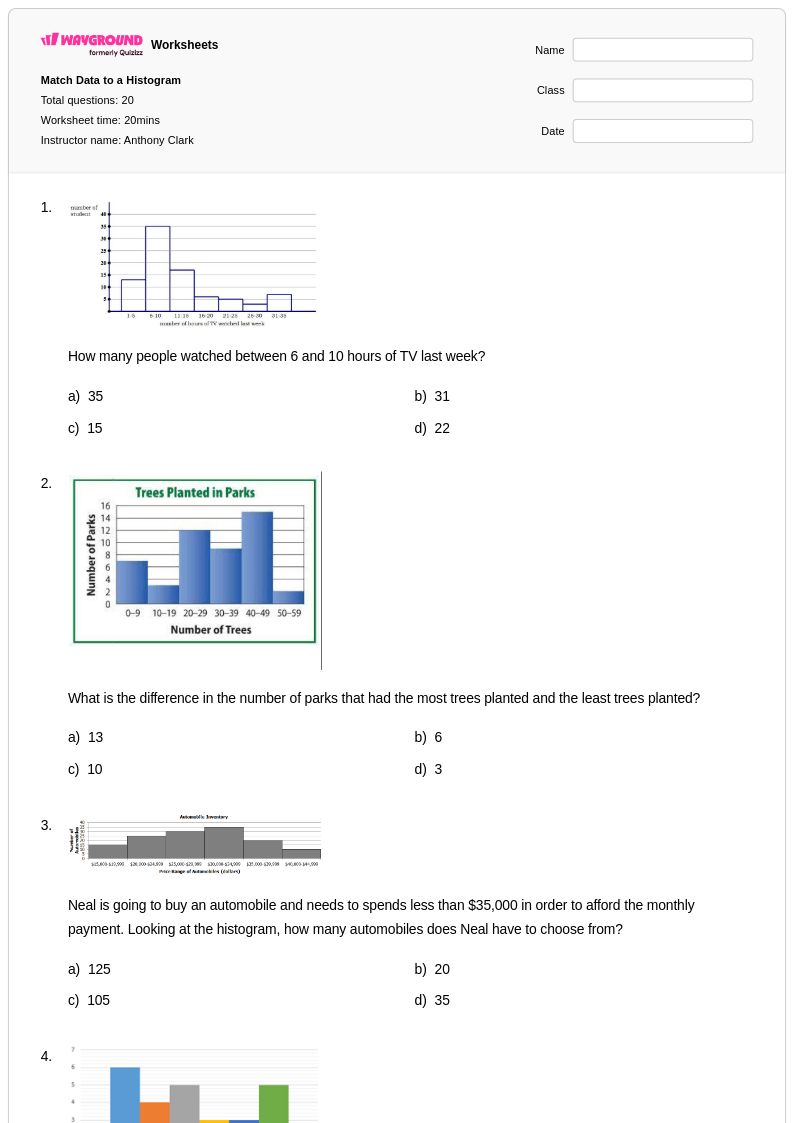
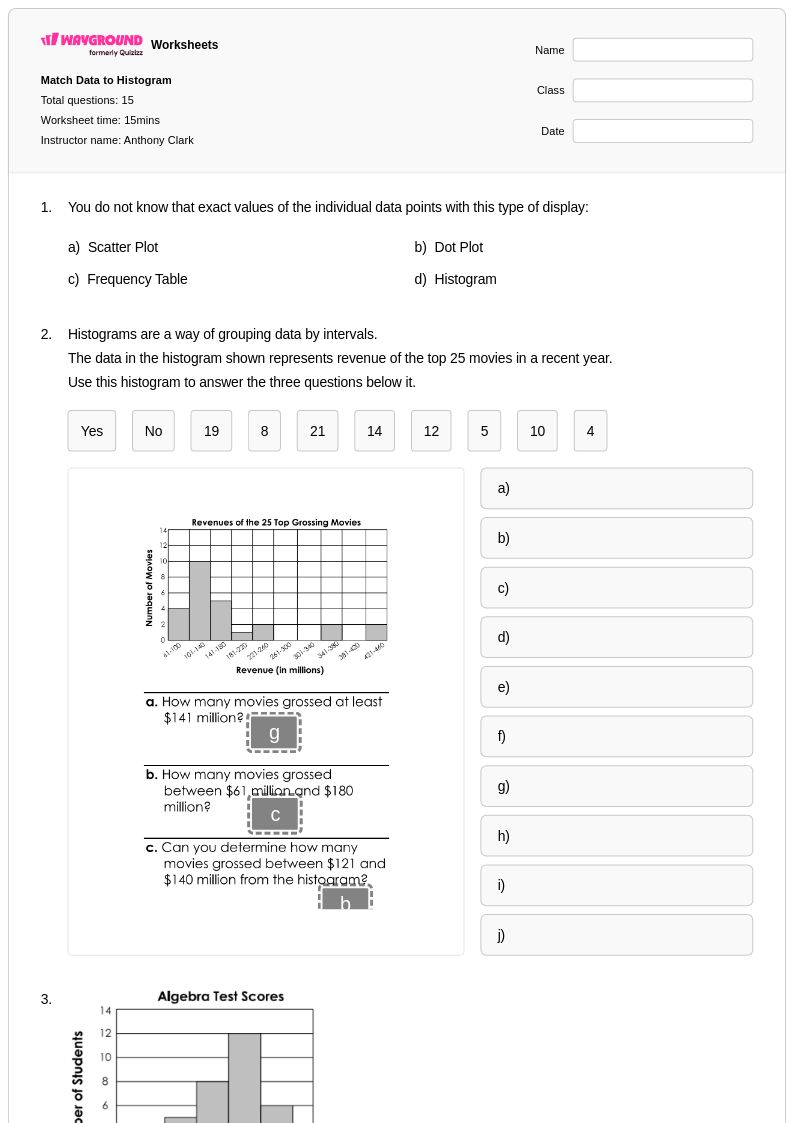
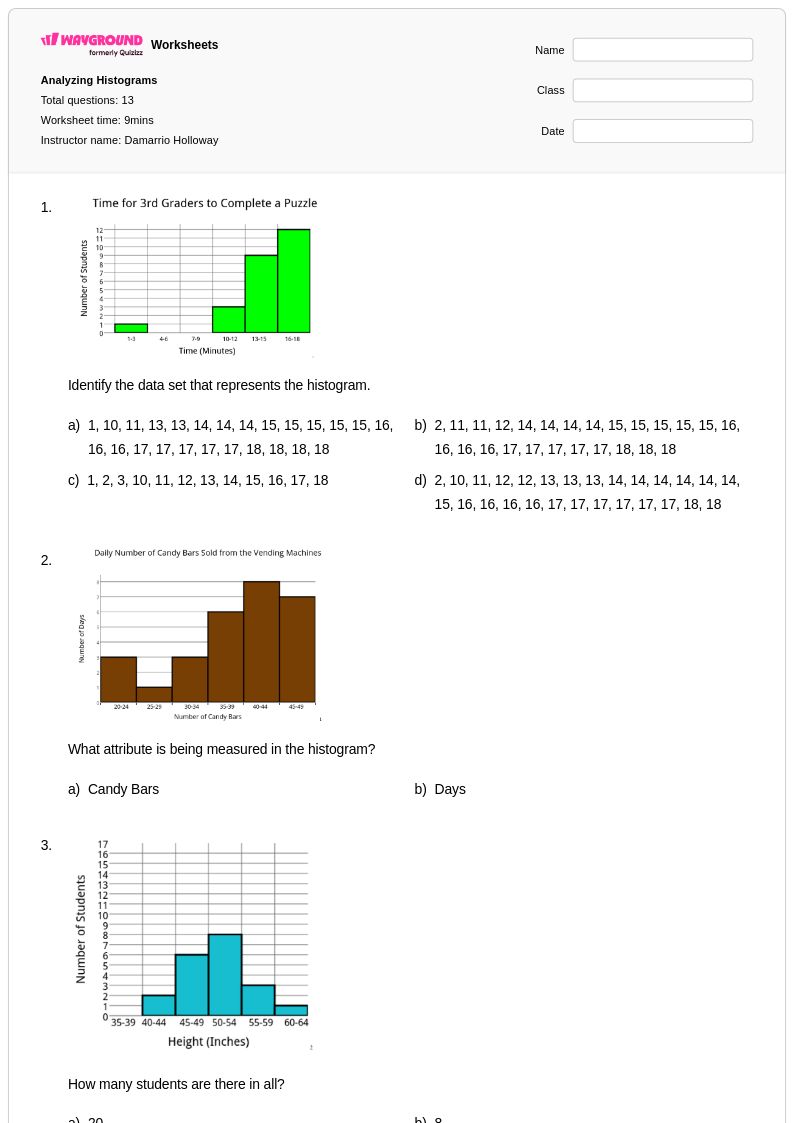
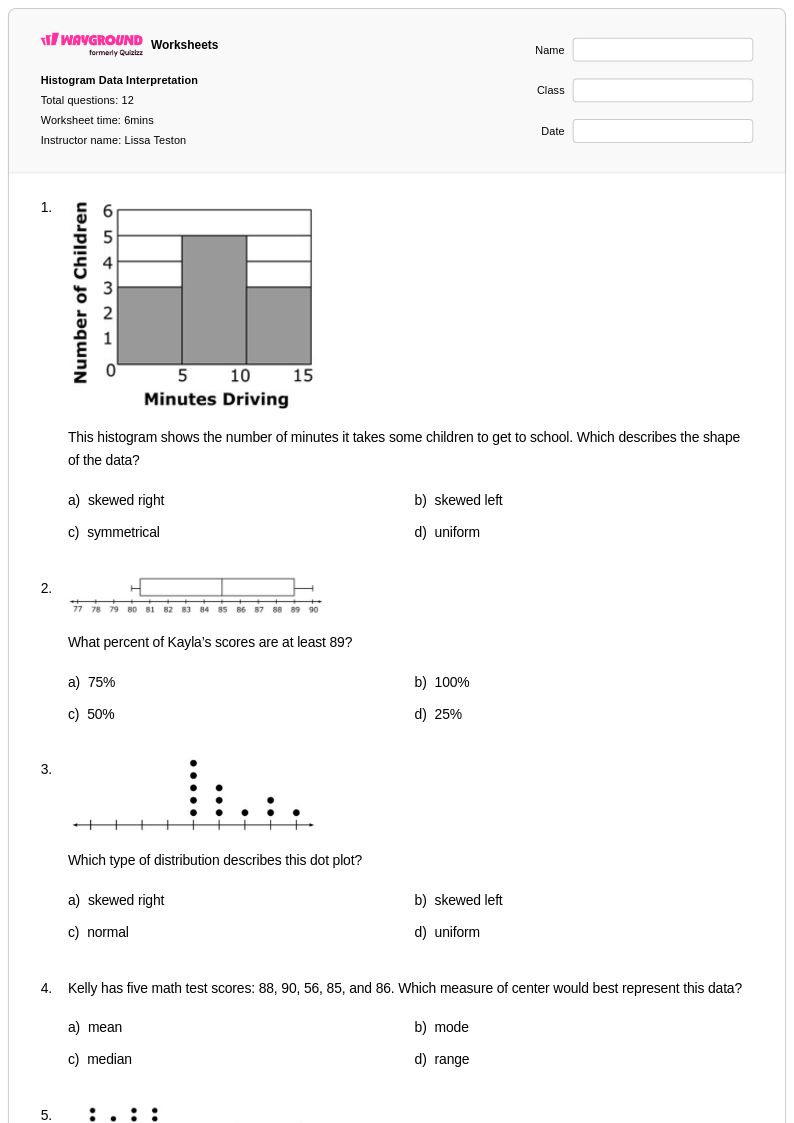
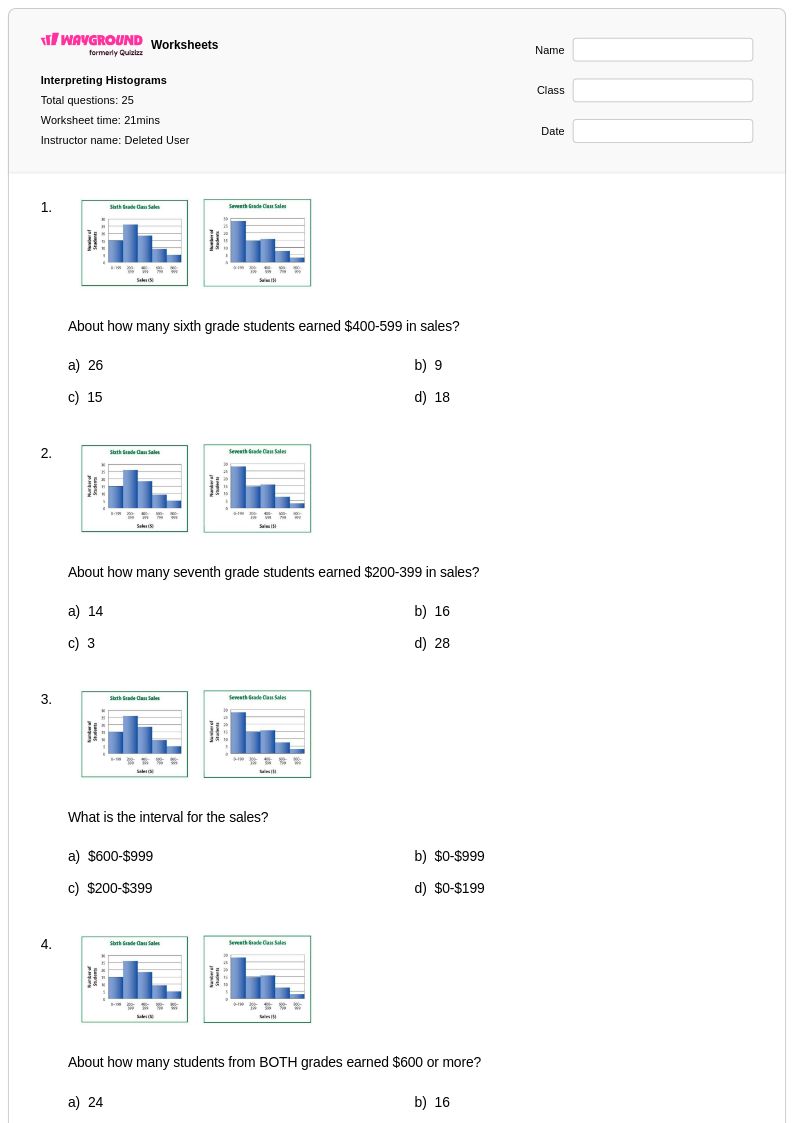
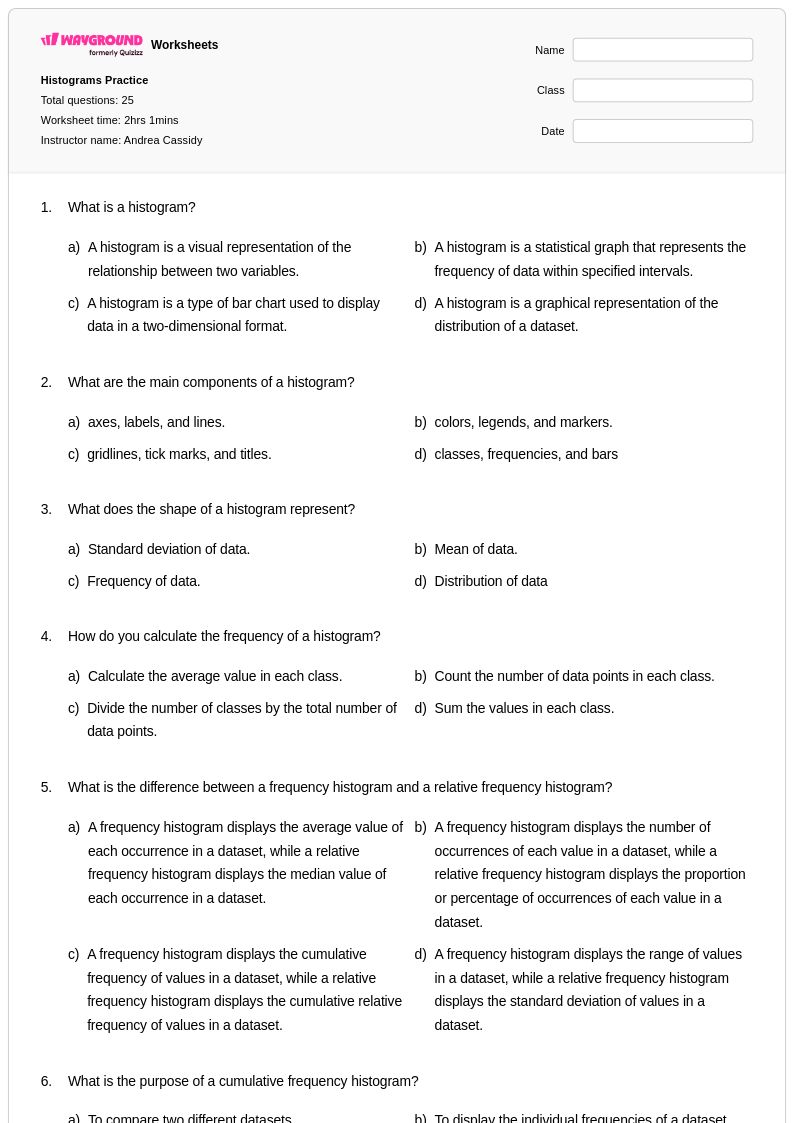
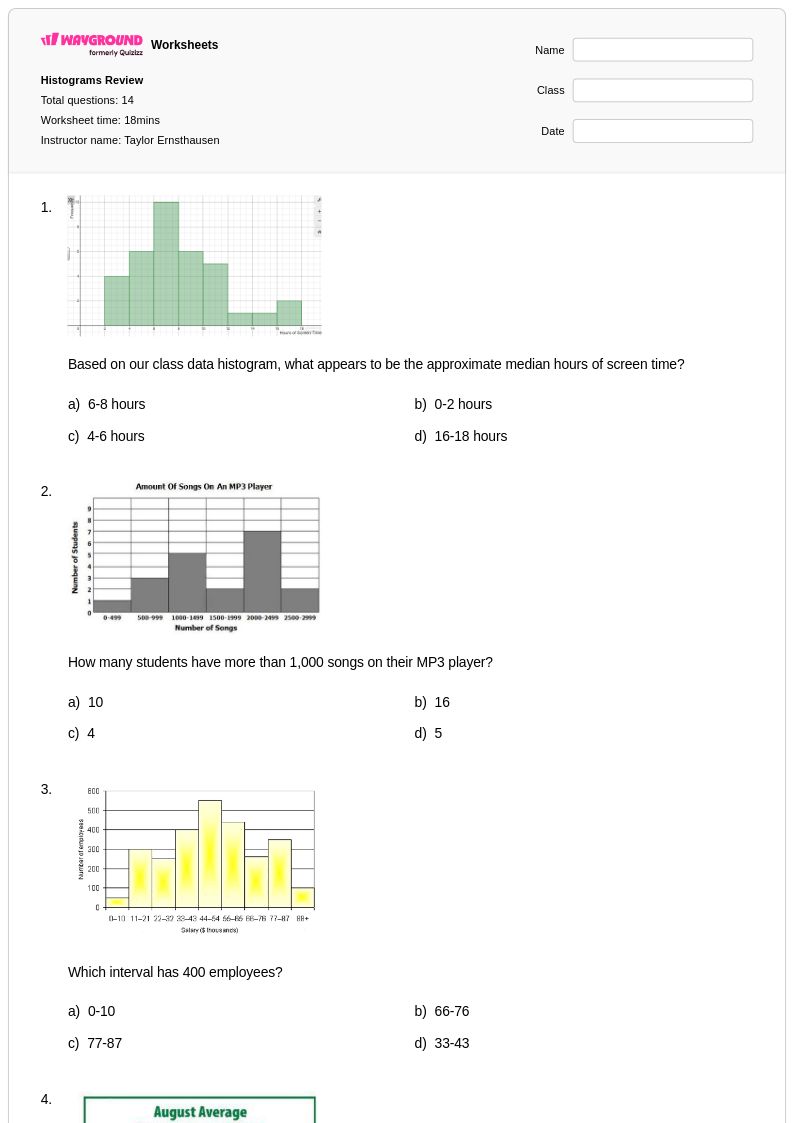
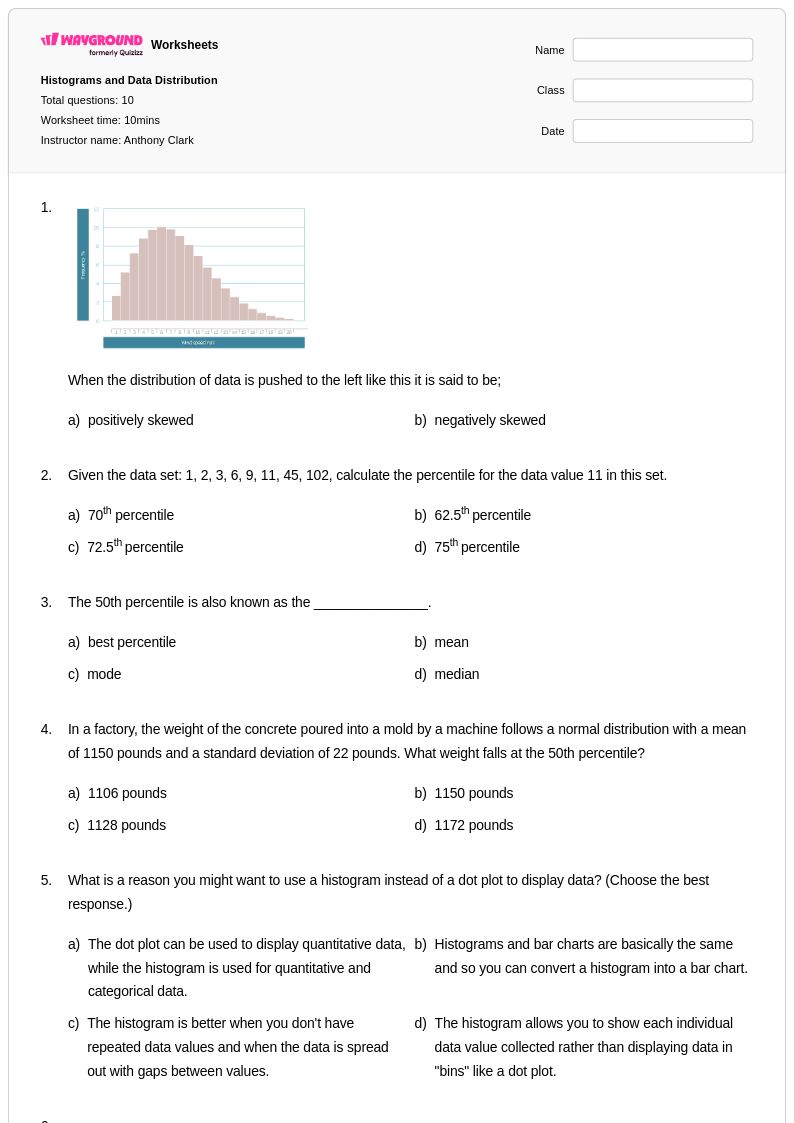
Histogram interpretation worksheets for Year 10 mathematics provide students with essential practice in analyzing and understanding data distributions through visual representations. These comprehensive worksheet collections available through Wayground (formerly Quizizz) focus on developing critical statistical literacy skills, including reading histogram axes, identifying frequency patterns, calculating measures of central tendency from grouped data, and drawing meaningful conclusions about data sets. Students work through practice problems that challenge them to interpret real-world scenarios presented in histogram format, analyze the shape and spread of distributions, and compare multiple data sets. Each worksheet comes with a detailed answer key to support independent learning, and these free printables offer educators flexible resources for both classroom instruction and homework assignments.
Wayground (formerly Quizizz) empowers educators with access to millions of teacher-created histogram interpretation resources specifically designed for Year 10 mathematics instruction. The platform's robust search and filtering capabilities allow teachers to quickly locate worksheets that align with specific curriculum standards and learning objectives, while differentiation tools enable customization based on individual student needs and skill levels. These versatile resources are available in both printable PDF format and interactive digital versions, making them ideal for traditional classroom settings, remote learning environments, or hybrid instruction models. Teachers can efficiently plan comprehensive data analysis units, provide targeted remediation for students struggling with statistical concepts, offer enrichment opportunities for advanced learners, and deliver consistent skill practice that builds confidence in interpreting graphical representations of quantitative information.
FAQs
How do I teach histogram interpretation to Grade 10 students?
What exercises help Grade 10 students practice reading histograms?
What mistakes do students commonly make when interpreting histograms?
How can I use these Grade 10 histogram interpretation worksheets?
How does histogram interpretation fit into the Common Core math progression?
How can I differentiate histogram practice for a mixed-ability Grade 10 class?
What grade level is histogram interpretation usually taught at?