
20Q
8th - Uni
17Q
9th - Uni
7Q
9th
23Q
9th
19Q
9th - Uni
20Q
11th - Uni
21Q
9th - 12th
20Q
8th - Uni
14Q
3rd
14Q
3rd
20Q
5th - Uni
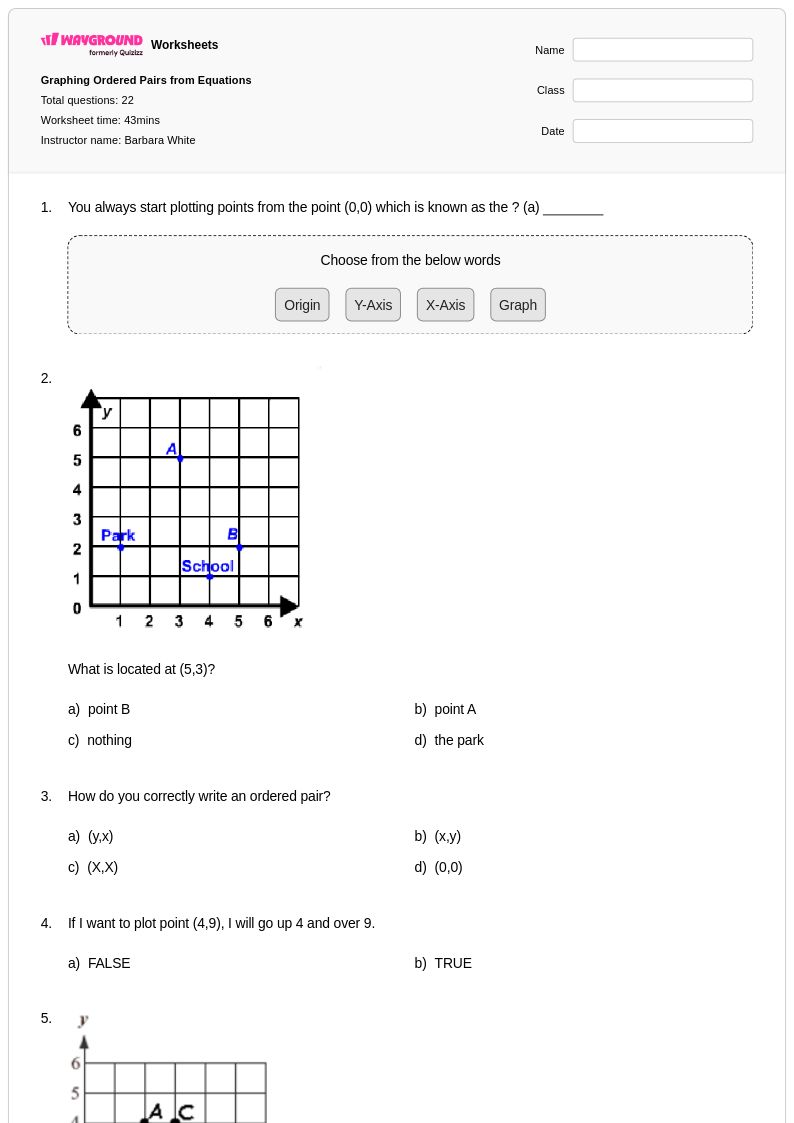
22Q
5th
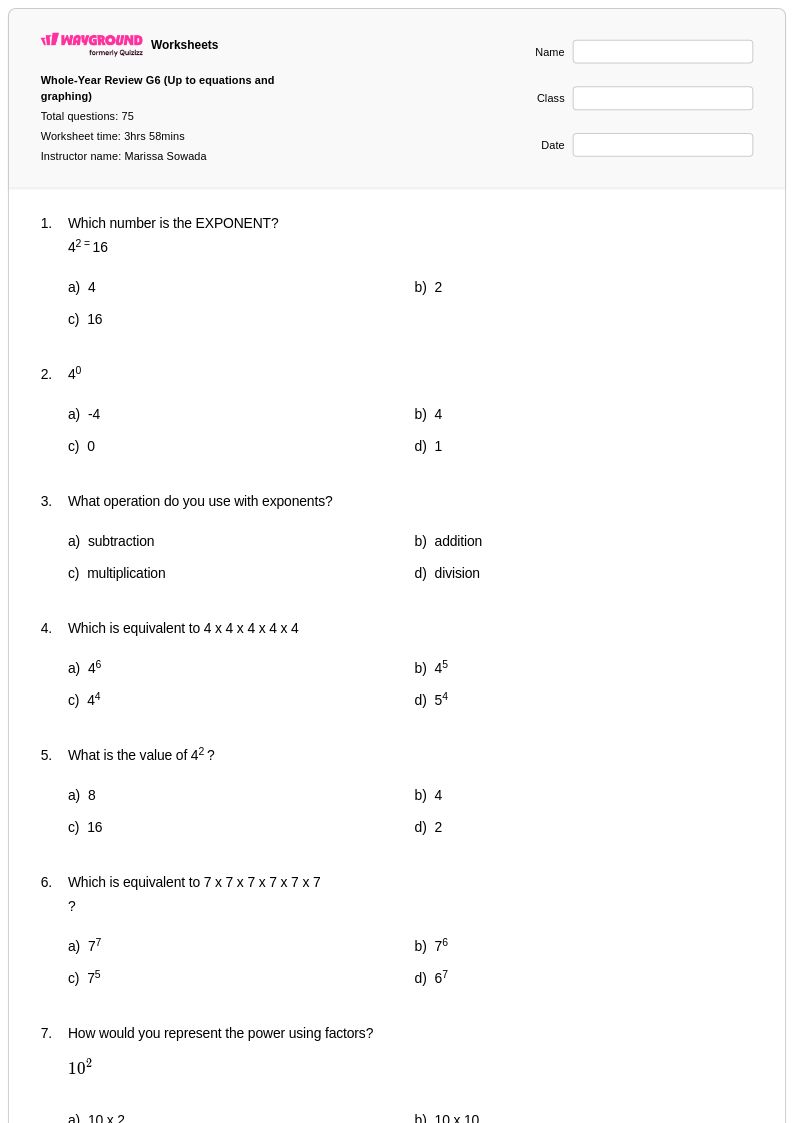
75Q
6th
22Q
5th
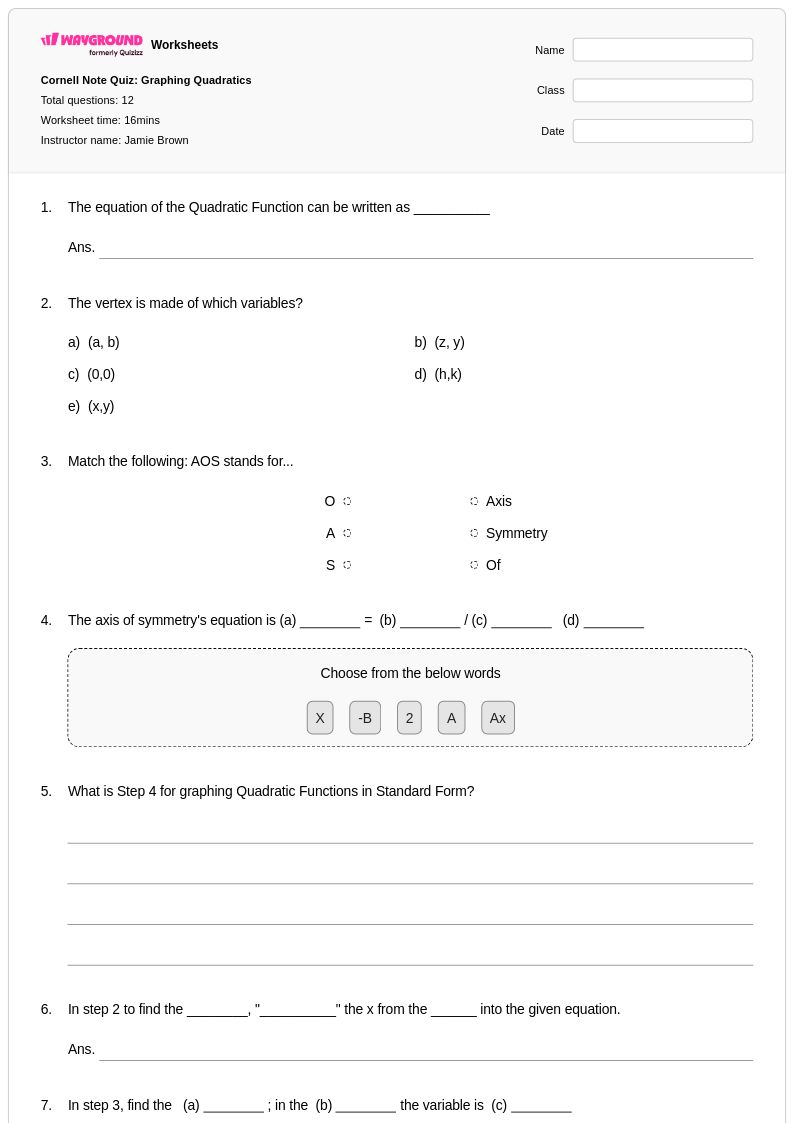
12Q
9th
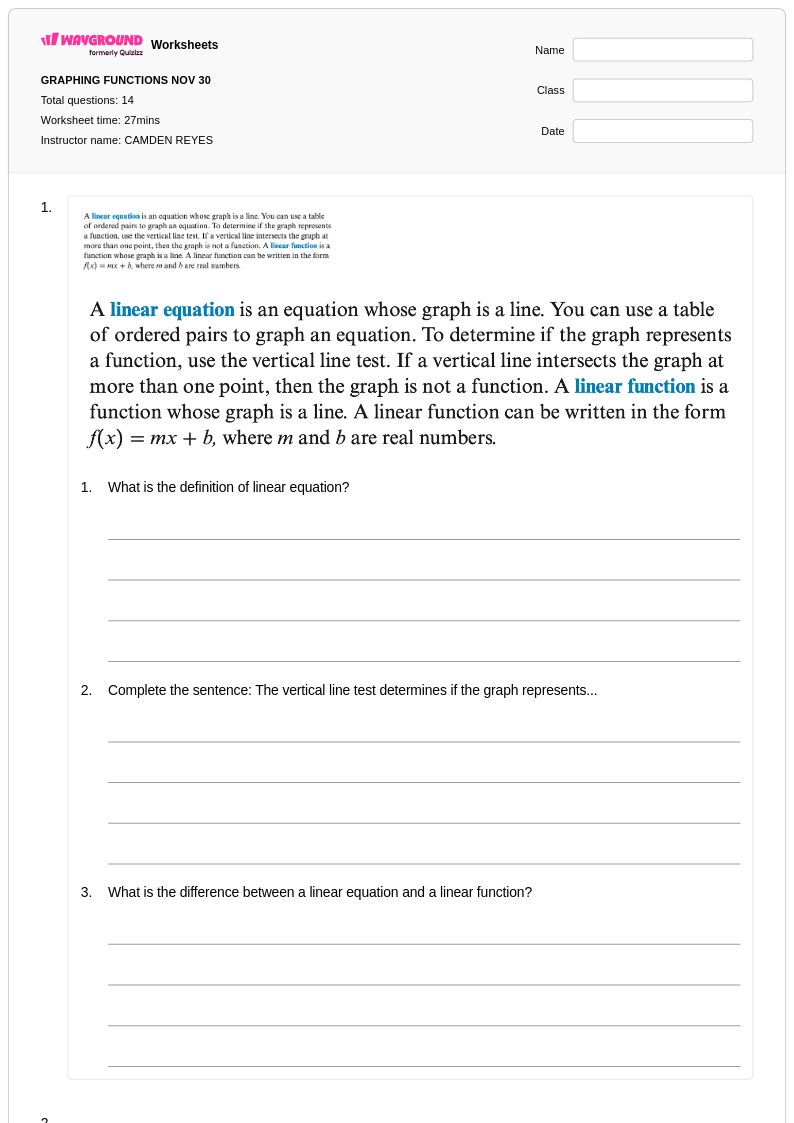
17Q
12th
21Q
9th - 12th
16Q
8th
18Q
7th
13Q
9th - 12th
22Q
8th
19Q
10th
15Q
8th - Uni
18Q
8th
Explorar hojas de trabajo por materias
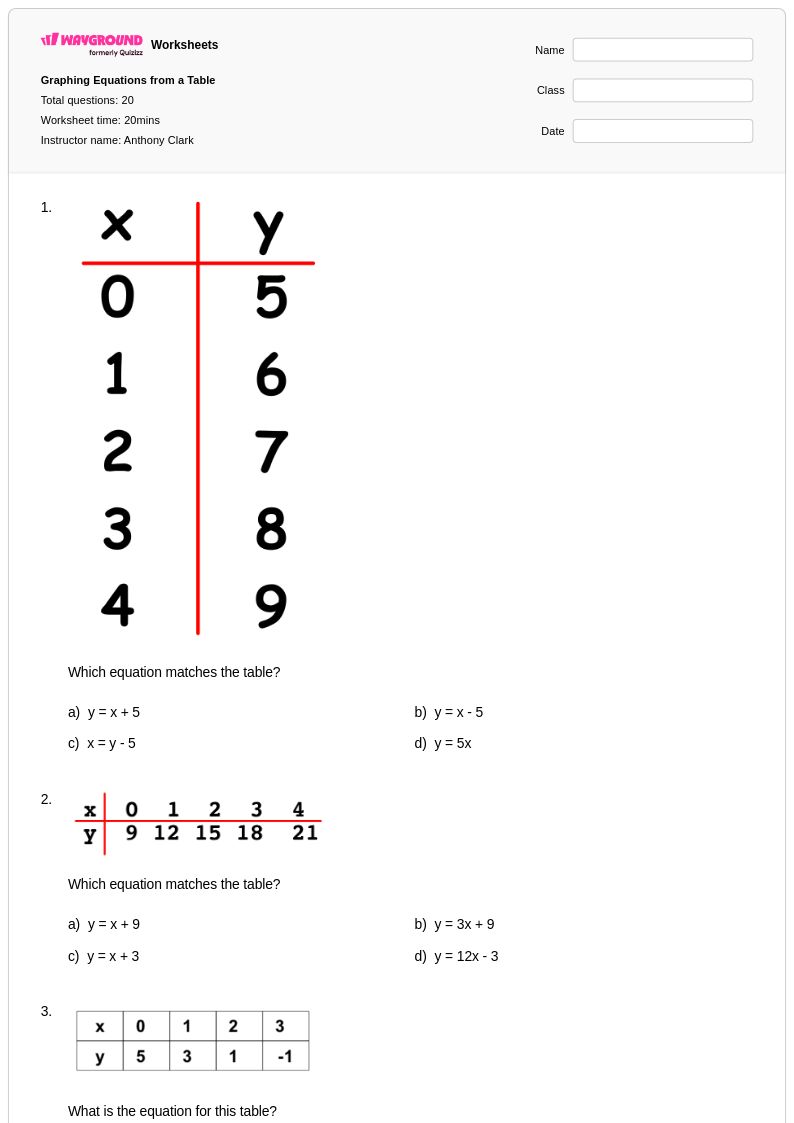
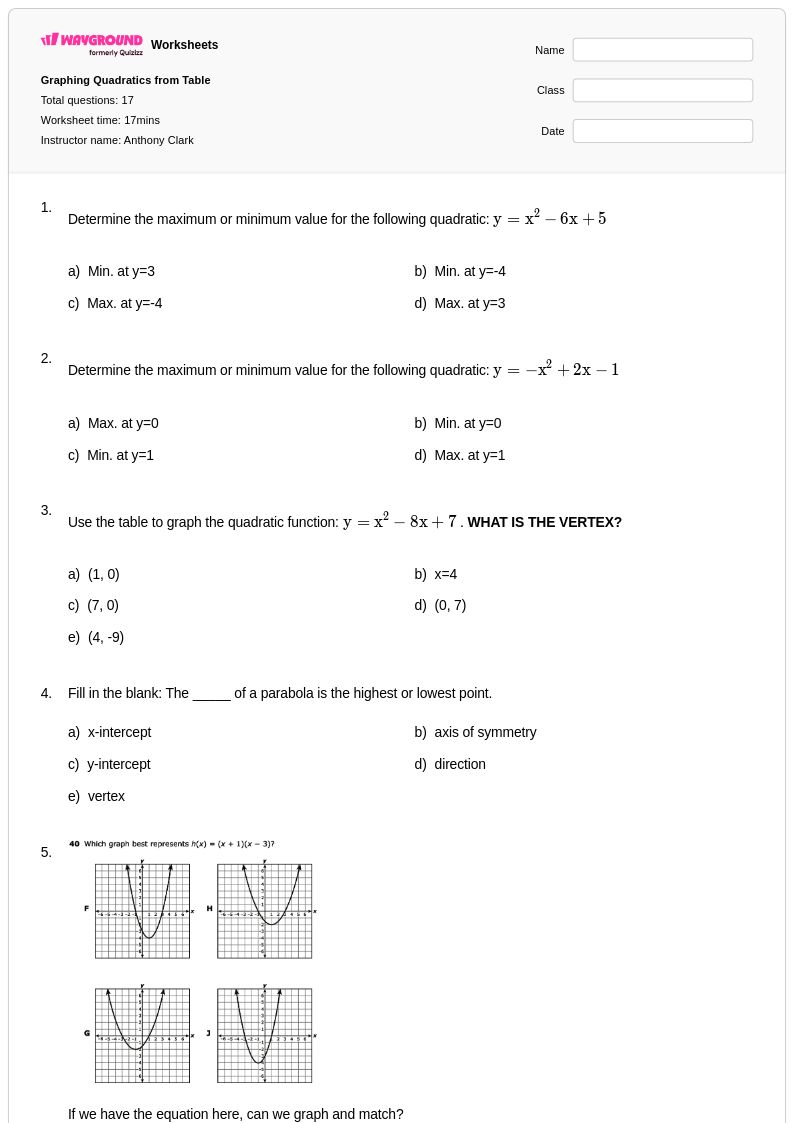
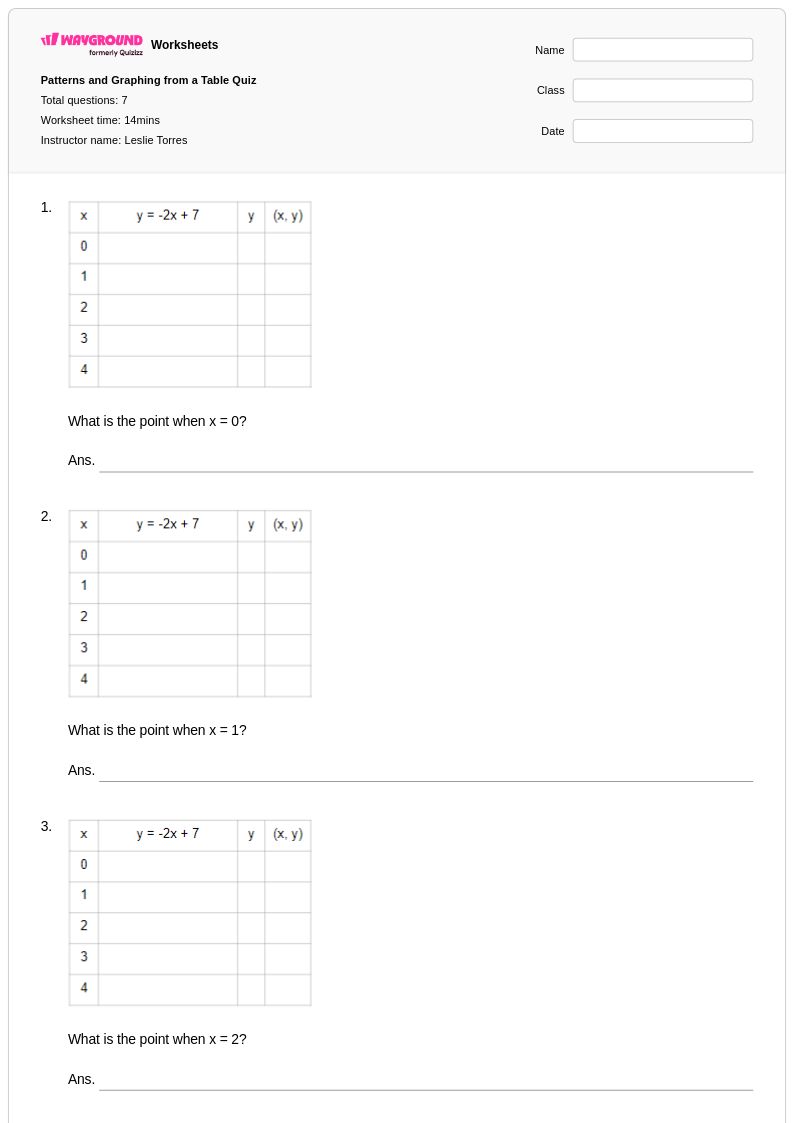
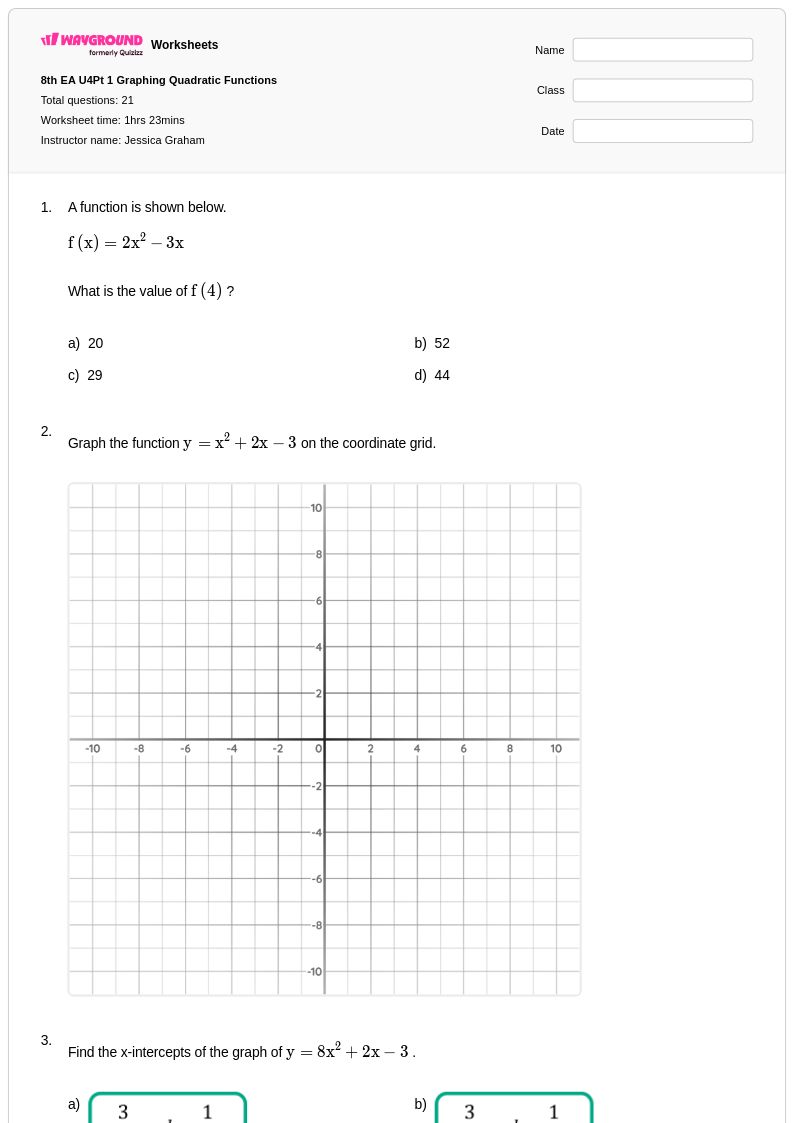
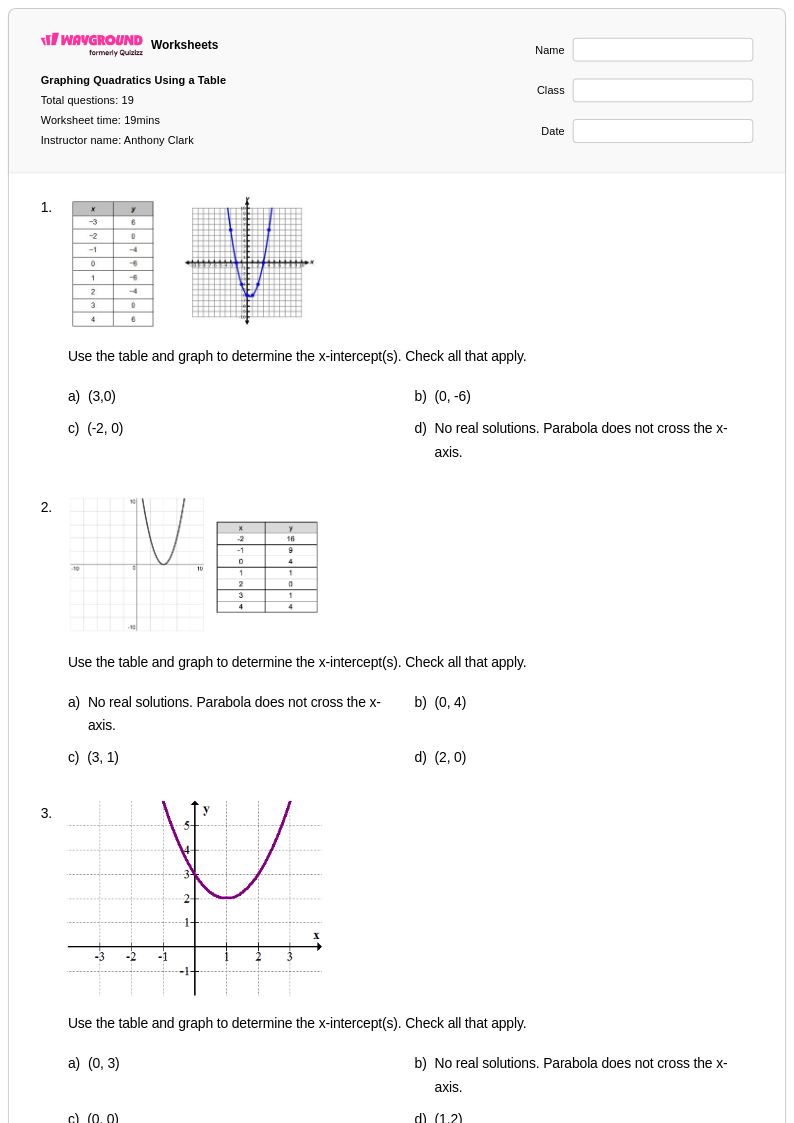
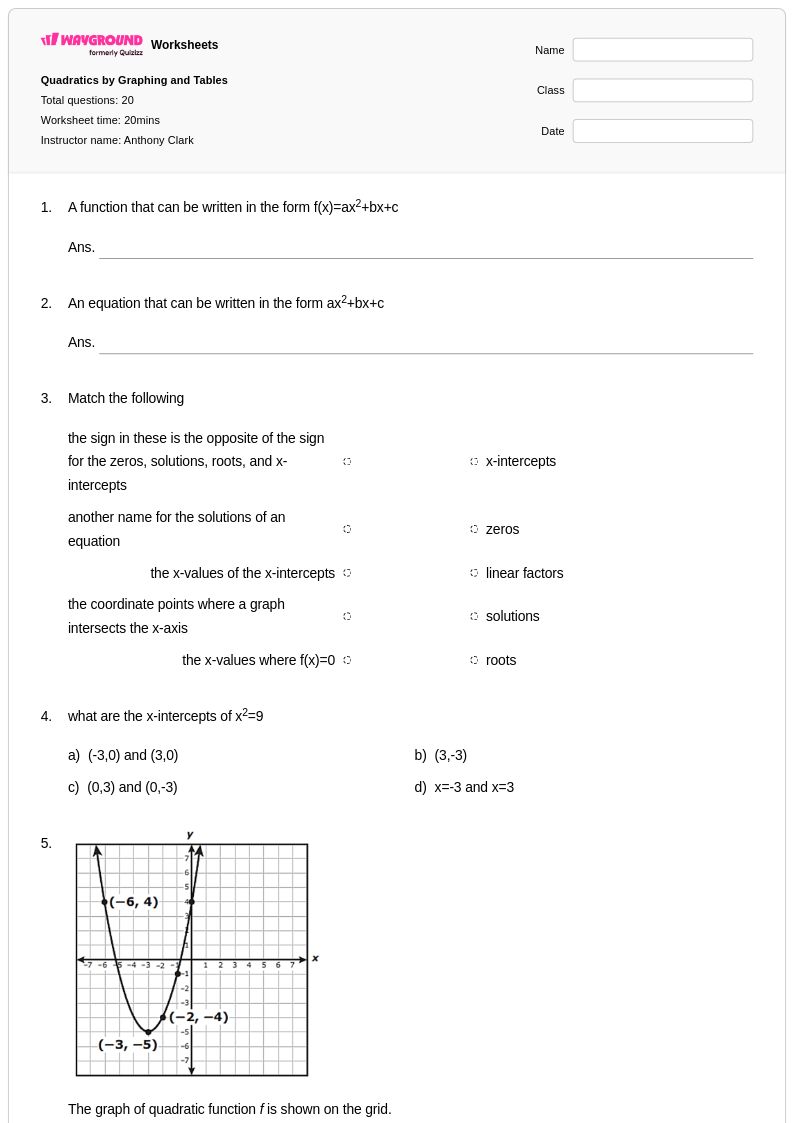
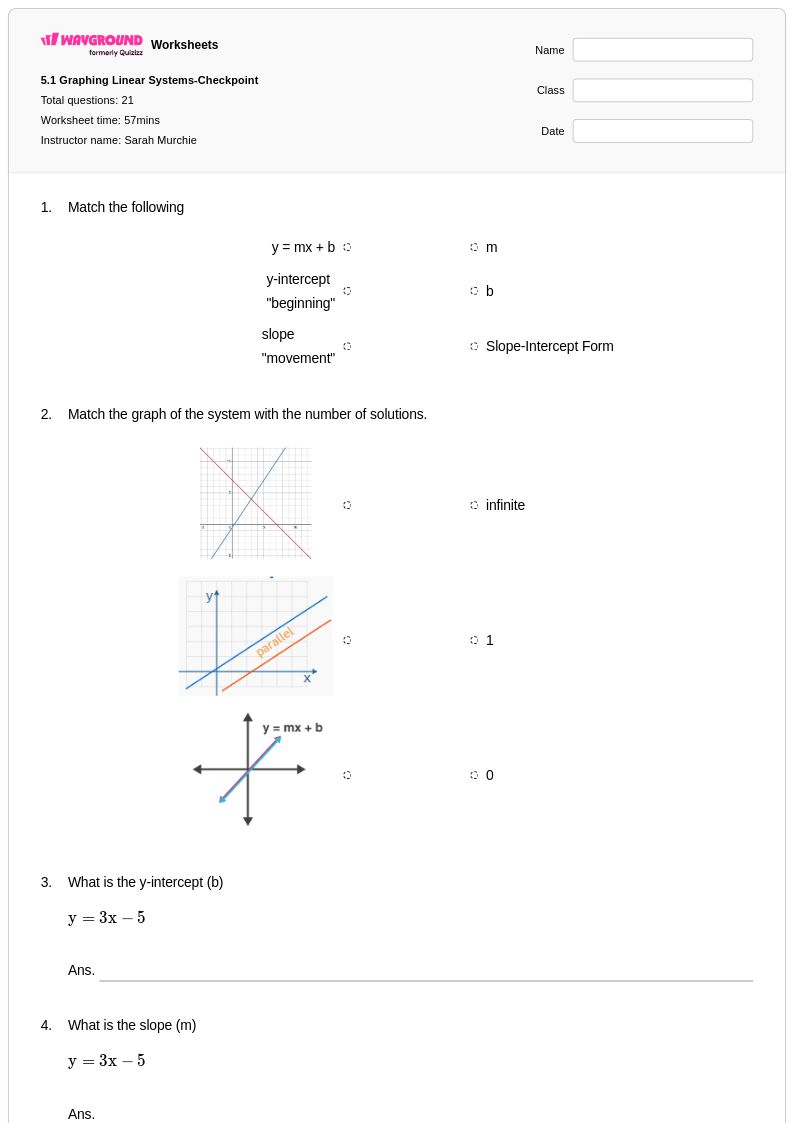
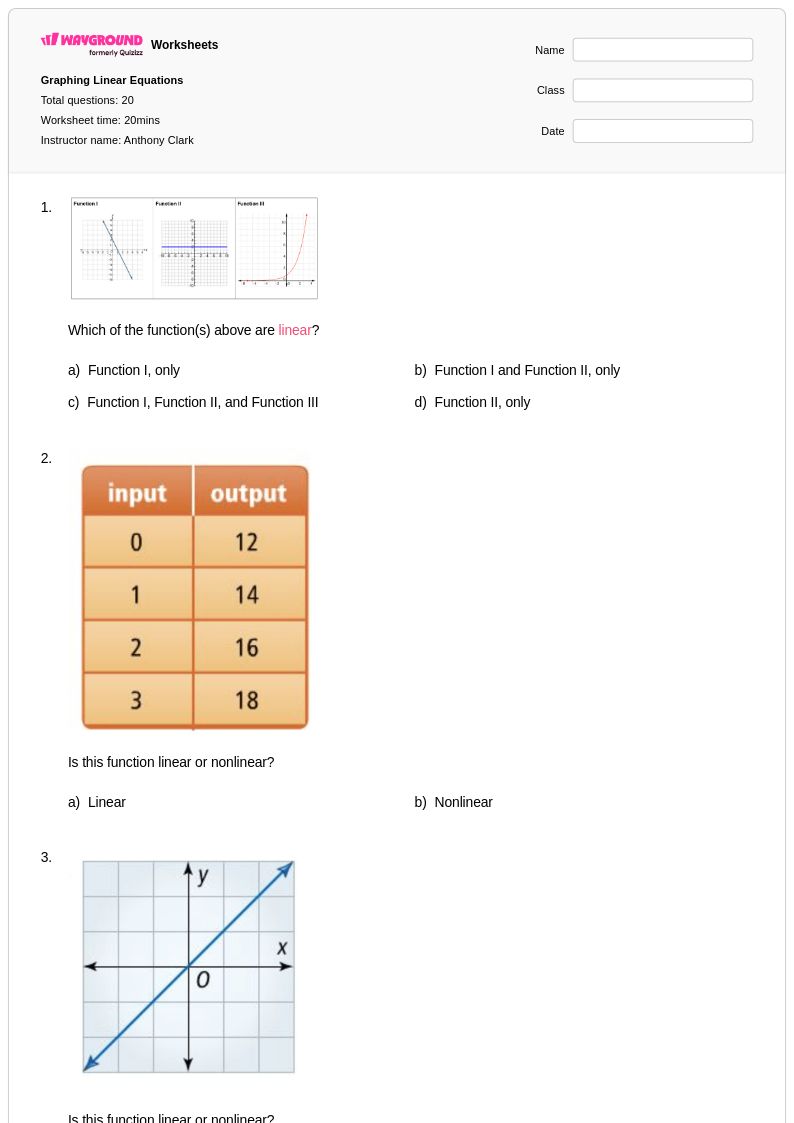
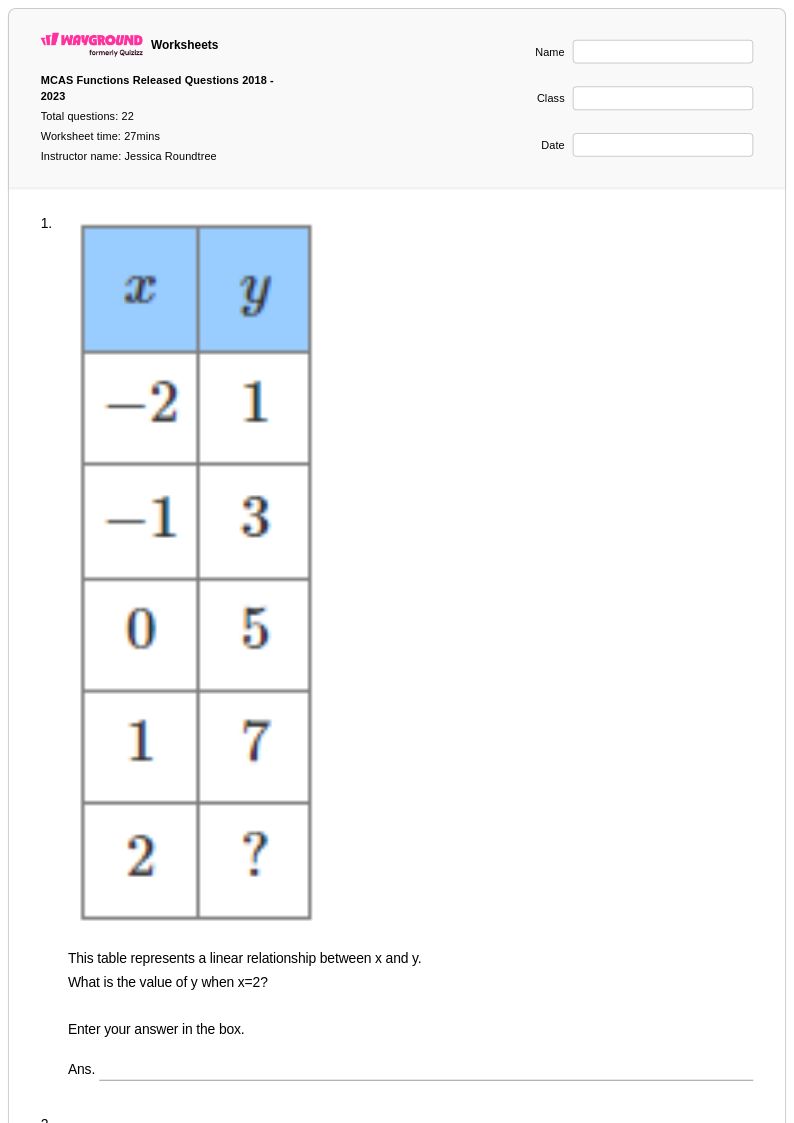
Explore printable Graphing from a Table worksheets
Graphing from a Table worksheets available through Wayground (formerly Quizizz) provide students with essential practice in translating numerical data into visual representations, a fundamental skill that bridges algebraic thinking and statistical analysis. These comprehensive printables focus on developing students' ability to identify patterns in tabular data, plot coordinate points accurately, and construct various types of graphs including line graphs, bar charts, and scatter plots. Each worksheet collection includes detailed answer keys and step-by-step solutions that help students understand the logical progression from raw data to finished graphs. The free practice problems range from basic plotting exercises to more complex multi-step graphing challenges, ensuring students build confidence while mastering this critical mathematical skill that appears across numerous grade levels and standardized assessments.
Wayground (formerly Quizizz) empowers educators with millions of teacher-created resources specifically designed for graphing from table instruction, featuring robust search and filtering capabilities that allow teachers to locate worksheets perfectly matched to their curriculum needs and standards alignment requirements. The platform's differentiation tools enable instructors to customize existing materials or create new variations that address diverse learning levels within a single classroom, supporting both remediation for struggling students and enrichment opportunities for advanced learners. Teachers can seamlessly access these resources in multiple formats, including downloadable pdf files for traditional paper-and-pencil practice or interactive digital versions for technology-enhanced learning environments. This flexibility streamlines lesson planning while providing targeted skill practice that helps students develop the analytical thinking necessary to interpret data relationships and communicate mathematical findings through visual representations.