
13 Q
8th
20 Q
9th - 12th
19 Q
7th
20 Q
8th - Uni
20 Q
11th - Uni
13 Q
8th
20 Q
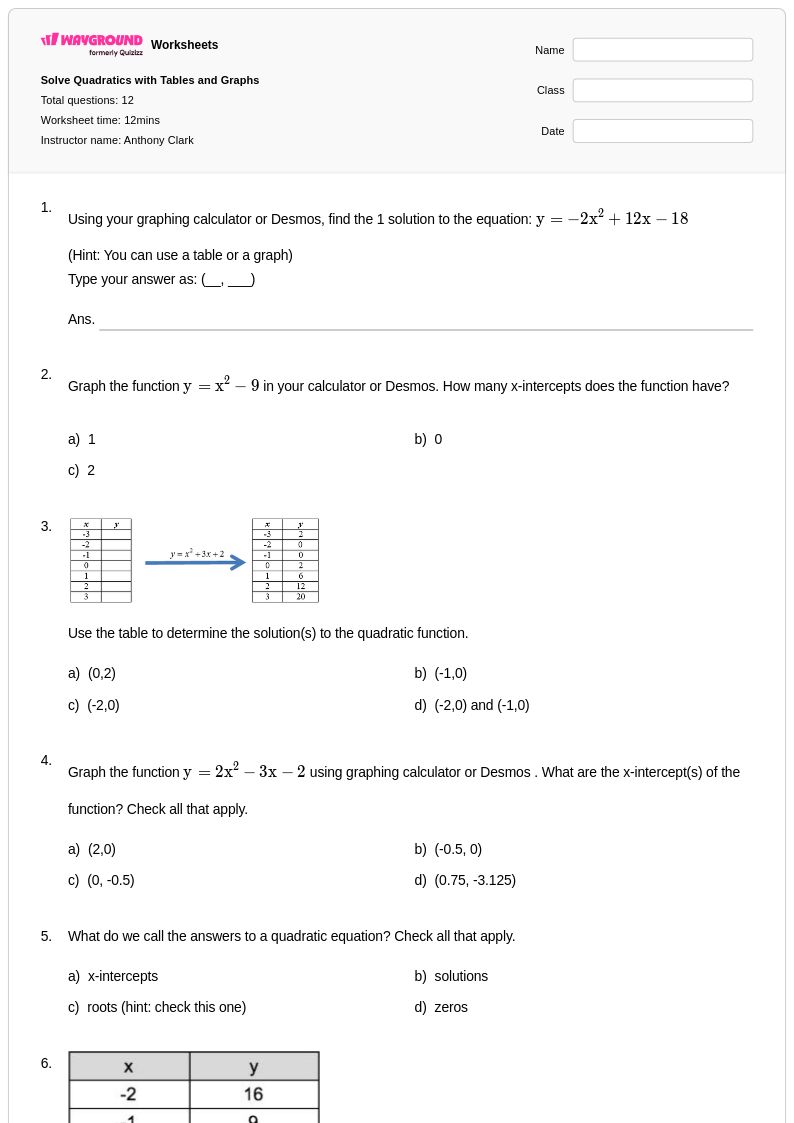
7th - Uni
20 Q
8th - Uni
16 Q
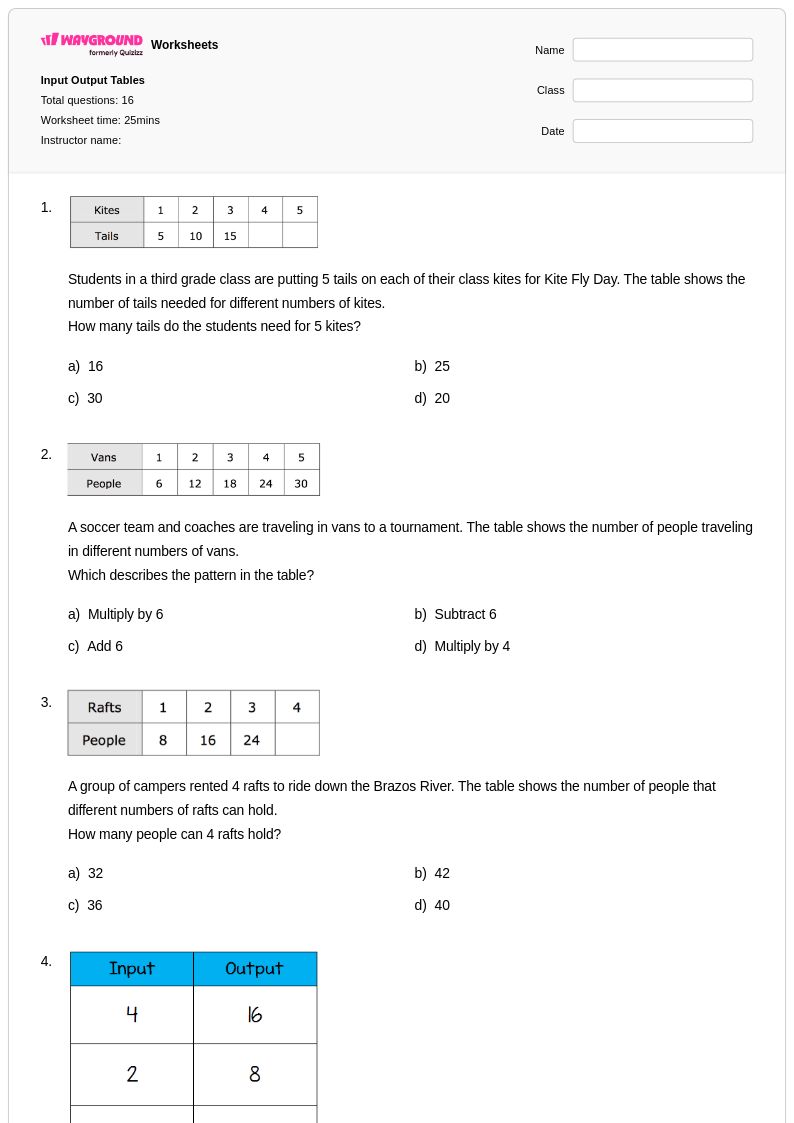
3rd
10 Q
8th
12 Q
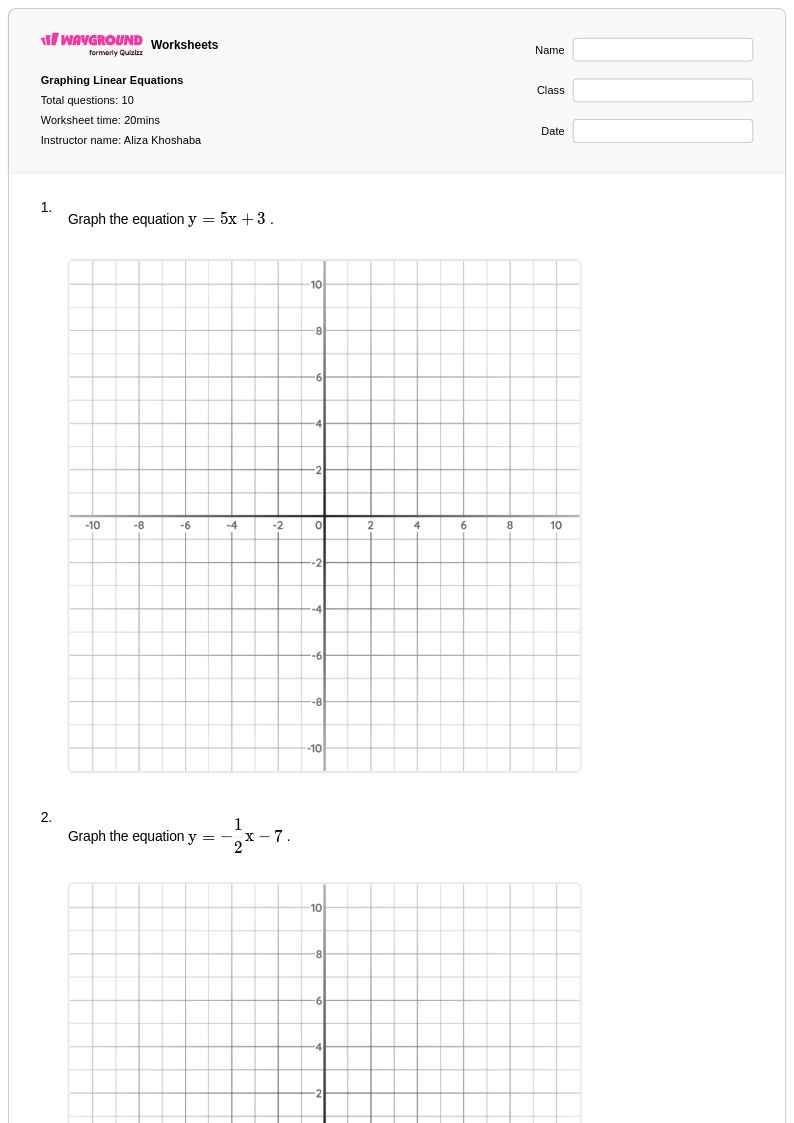
9th - Uni
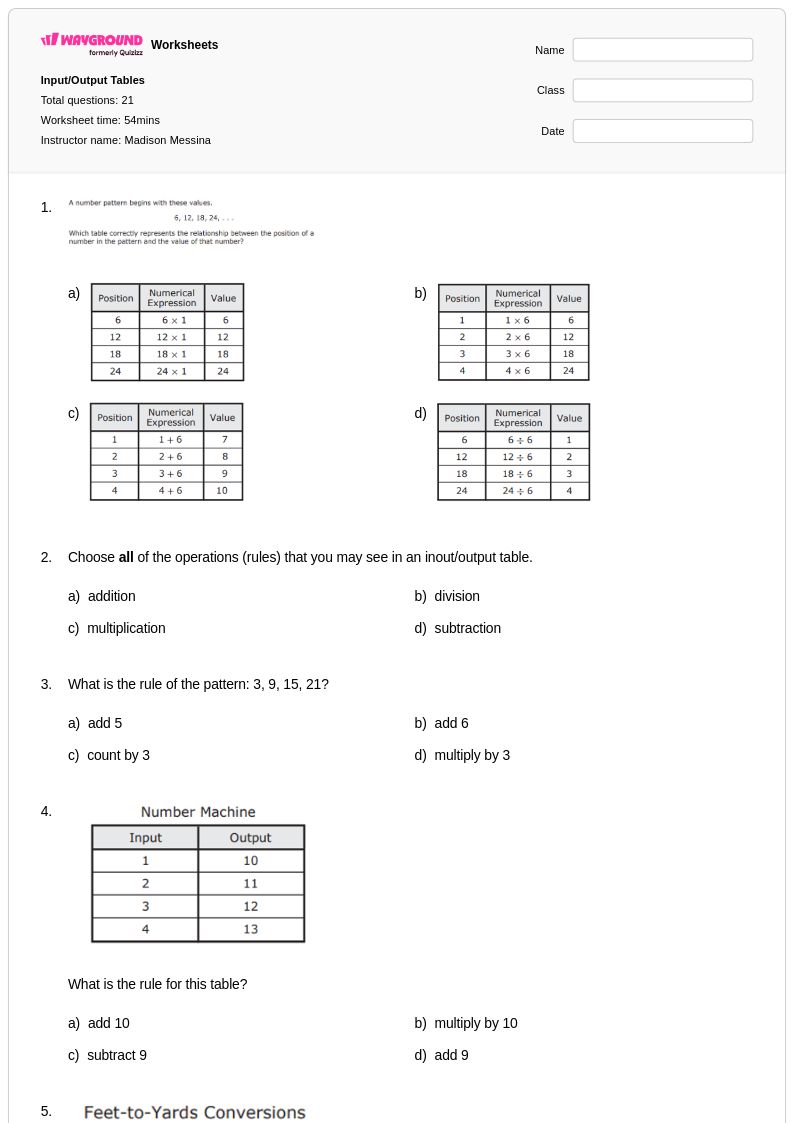
21 Q
4th
12 Q
9th
16 Q
8th
16 Q
8th
19 Q
9th - Uni
13 Q
11th - Uni
24 Q
5th
15 Q
9th
11 Q
3rd
20 Q
9th - 12th
15 Q
9th
40 Q
9th - Uni
24 Q
5th
Explore Worksheets by Subjects
Explore printable Graphing with Tables worksheets
Graphing with Tables worksheets available through Wayground (formerly Quizizz) provide students with essential practice in translating numerical data into visual representations and interpreting relationships between variables. These comprehensive resources strengthen critical mathematical skills including data organization, coordinate plotting, pattern recognition, and graph analysis across various formats such as line graphs, bar charts, and scatter plots. Each worksheet collection includes detailed answer keys and step-by-step solutions that help students understand the connection between tabular data and graphical displays. The free printables offer structured practice problems that guide learners through the process of selecting appropriate scales, labeling axes correctly, and drawing accurate representations of data sets while developing their ability to extract meaningful information from both tables and their corresponding graphs.
Wayground (formerly Quizizz) supports mathematics educators with an extensive collection of teacher-created graphing with tables resources, featuring millions of worksheets that can be easily located through robust search and filtering capabilities. The platform's standards-aligned materials enable teachers to find precisely targeted content for skill practice, remediation, and enrichment activities while offering flexible customization options to meet diverse classroom needs. These differentiation tools allow educators to modify worksheets for various ability levels, ensuring all students can engage meaningfully with data interpretation and graphing concepts. Available in both printable pdf formats and interactive digital versions, these resources streamline lesson planning and provide teachers with ready-to-use materials that reinforce the fundamental connection between numerical data and visual representation in mathematics instruction.