
10 Q
5th
11 Q
4th
10 Q
4th
20 Q
4th - Uni
13 Q
5th - Uni
20 Q
5th - Uni
15 Q
4th - Uni
20 Q
6th - Uni

27 Q
3rd
27 Q
3rd
13 Q
5th - Uni
15 Q
5th - Uni
10 Q
6th - Uni
10 Q
6th
14 Q
4th - Uni
12 Q
5th - Uni
19 Q
6th - Uni
12 Q
4th
13 Q
3rd
20 Q
8th
20 Q
9th - 12th
13 Q
8th
10 Q
8th
14 Q
8th
Explore Worksheets by Subjects
Explore printable Line Plots worksheets
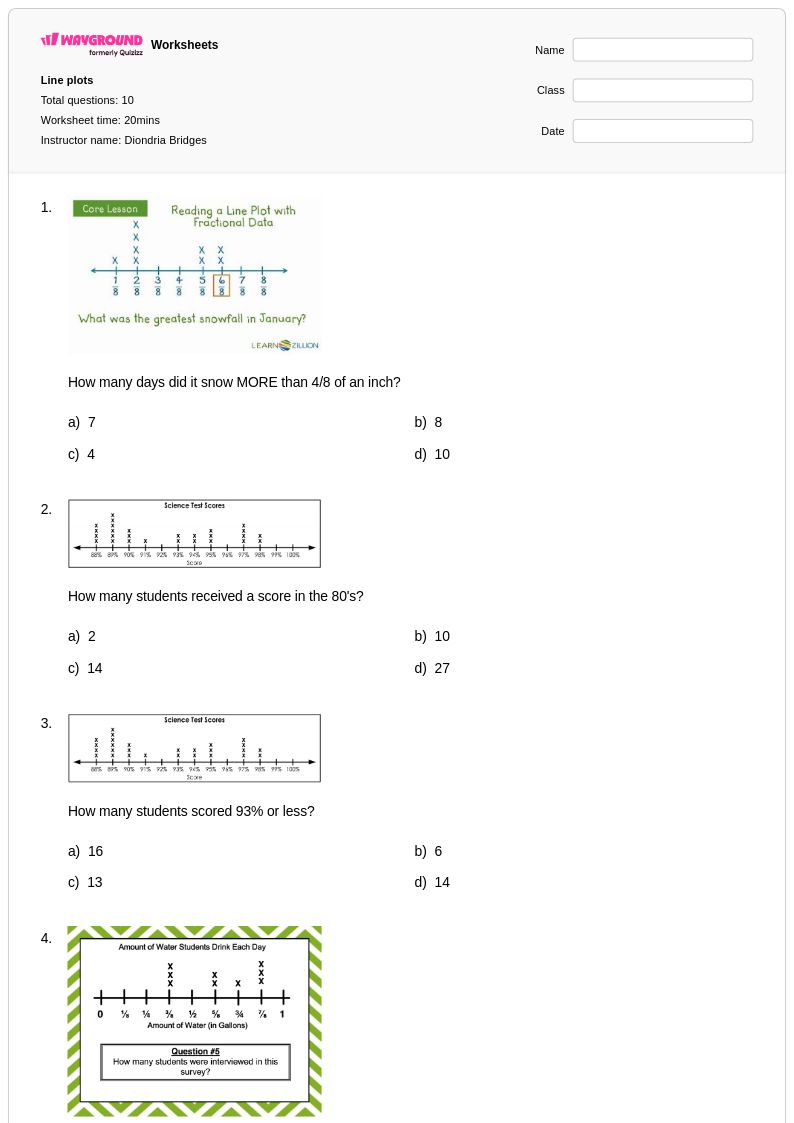
Line plots provide students with a fundamental introduction to data visualization and statistical analysis through hands-on practice with organizing and interpreting numerical information. Wayground's extensive collection of line plot worksheets offers comprehensive practice problems that guide students through creating, reading, and analyzing these essential graphical representations of data sets. These free printable resources strengthen critical mathematical skills including data collection, frequency analysis, and pattern recognition while building foundational understanding of how information can be displayed visually. Each worksheet includes detailed answer keys and covers various complexity levels, from basic dot plots showing simple frequency distributions to more advanced line plots requiring students to interpret trends, calculate measures of central tendency, and draw conclusions from the displayed data.
Wayground, formerly Quizizz, empowers educators with millions of teacher-created line plot resources that can be seamlessly integrated into mathematics instruction across multiple learning environments. The platform's robust search and filtering capabilities allow teachers to quickly locate worksheets aligned with specific curriculum standards and learning objectives, while built-in differentiation tools enable customization for diverse student needs and ability levels. These comprehensive collections are available in both printable PDF format and interactive digital versions, providing flexibility for classroom instruction, homework assignments, remediation sessions, and enrichment activities. Teachers can efficiently plan targeted skill practice sessions, assess student understanding of data representation concepts, and provide immediate feedback through the platform's comprehensive answer key system, ultimately supporting more effective mathematics instruction and improved student outcomes in statistical literacy.