
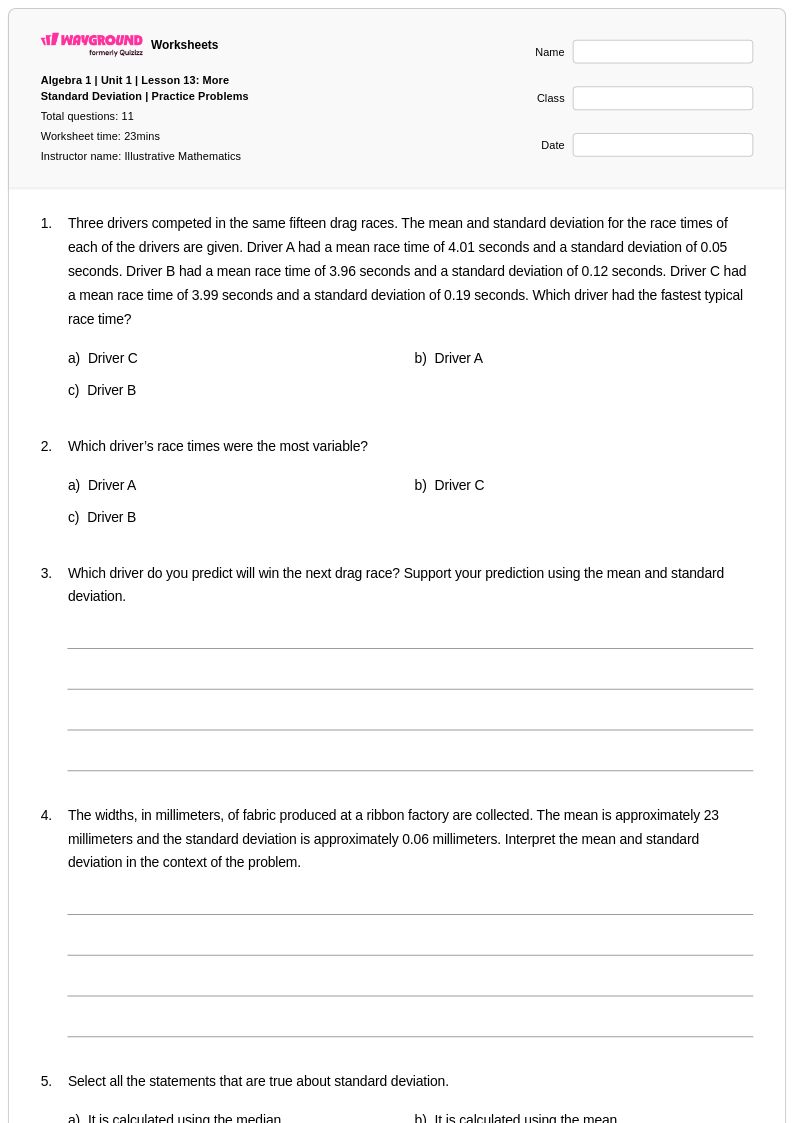
11 คิว
6th - Uni
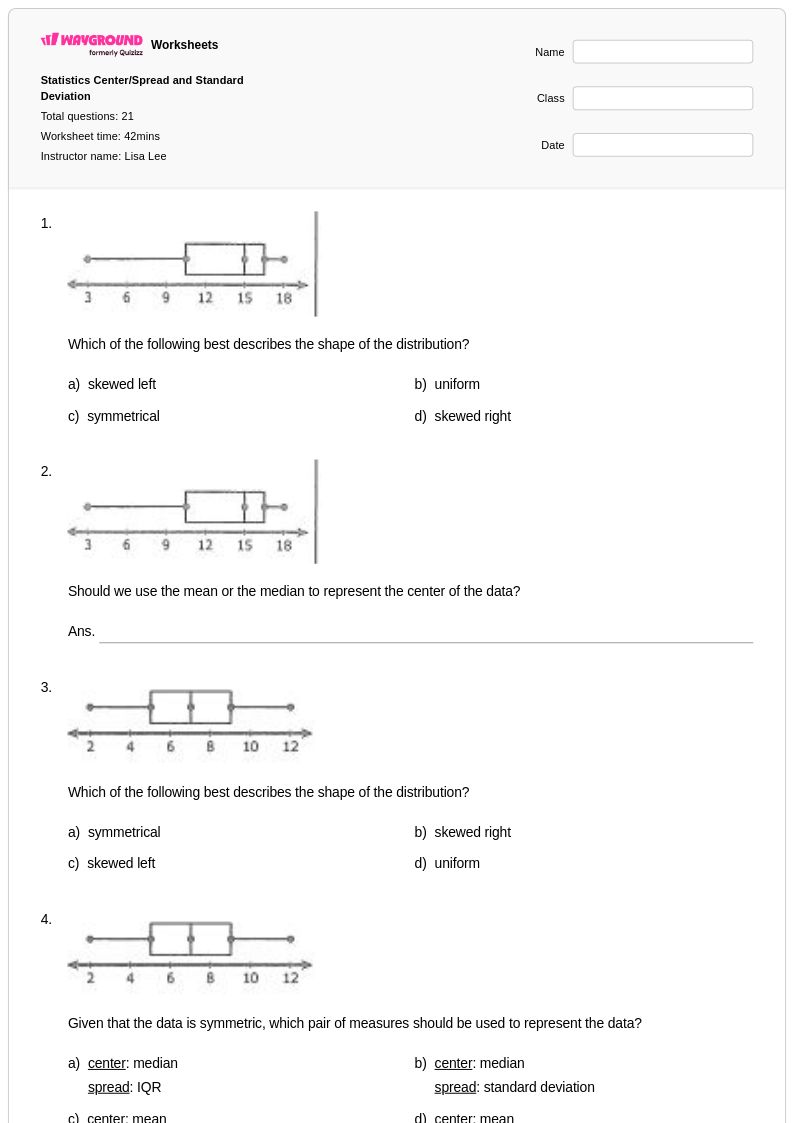
21 คิว
6th - 9th
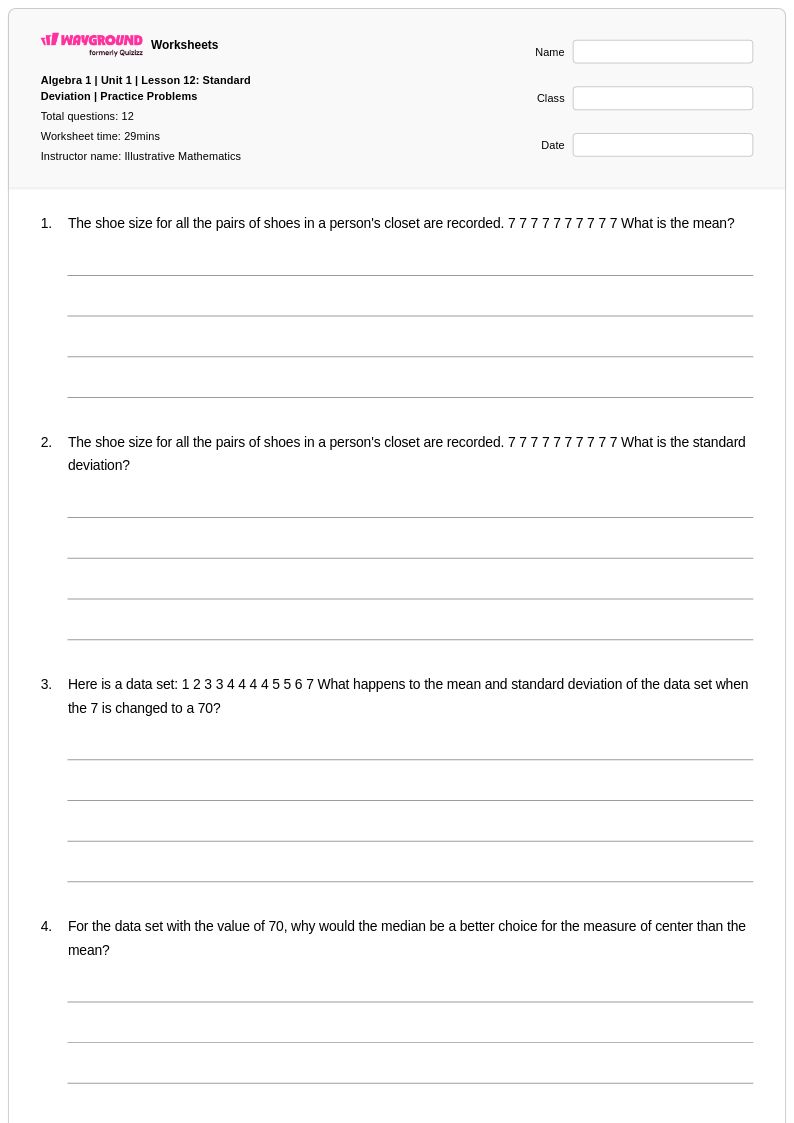
12 คิว
6th - Uni
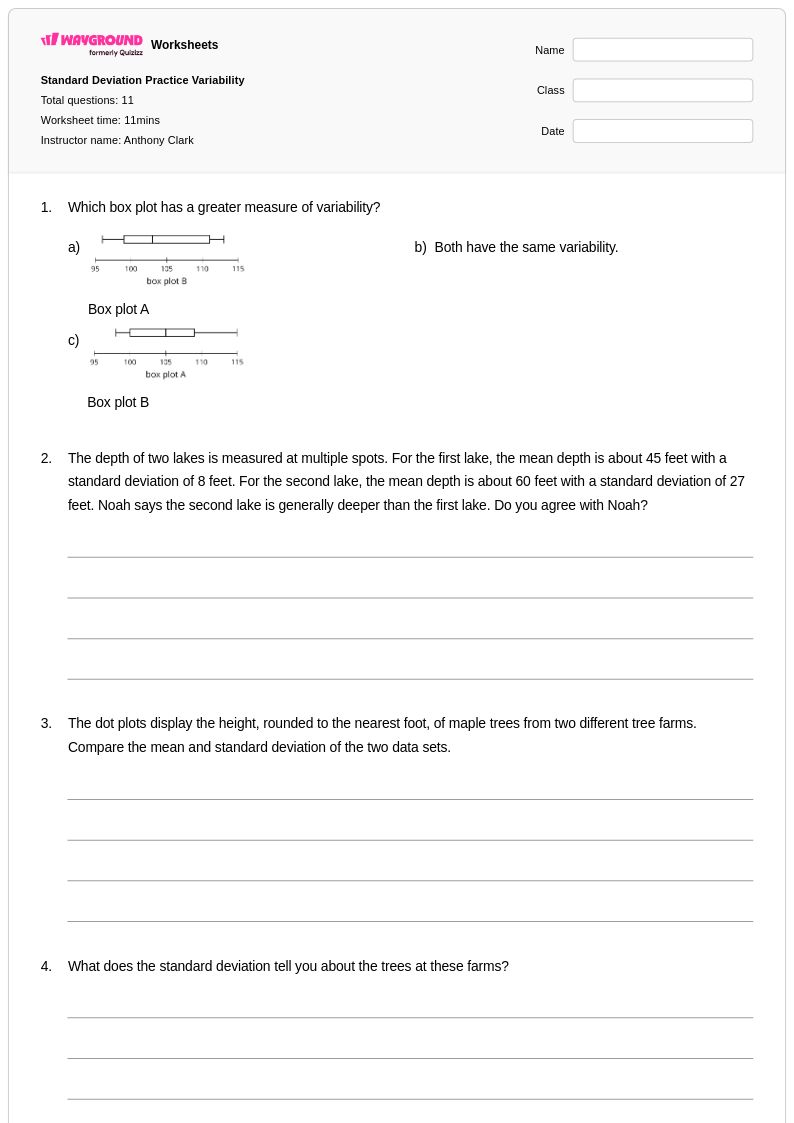
11 คิว
6th - Uni
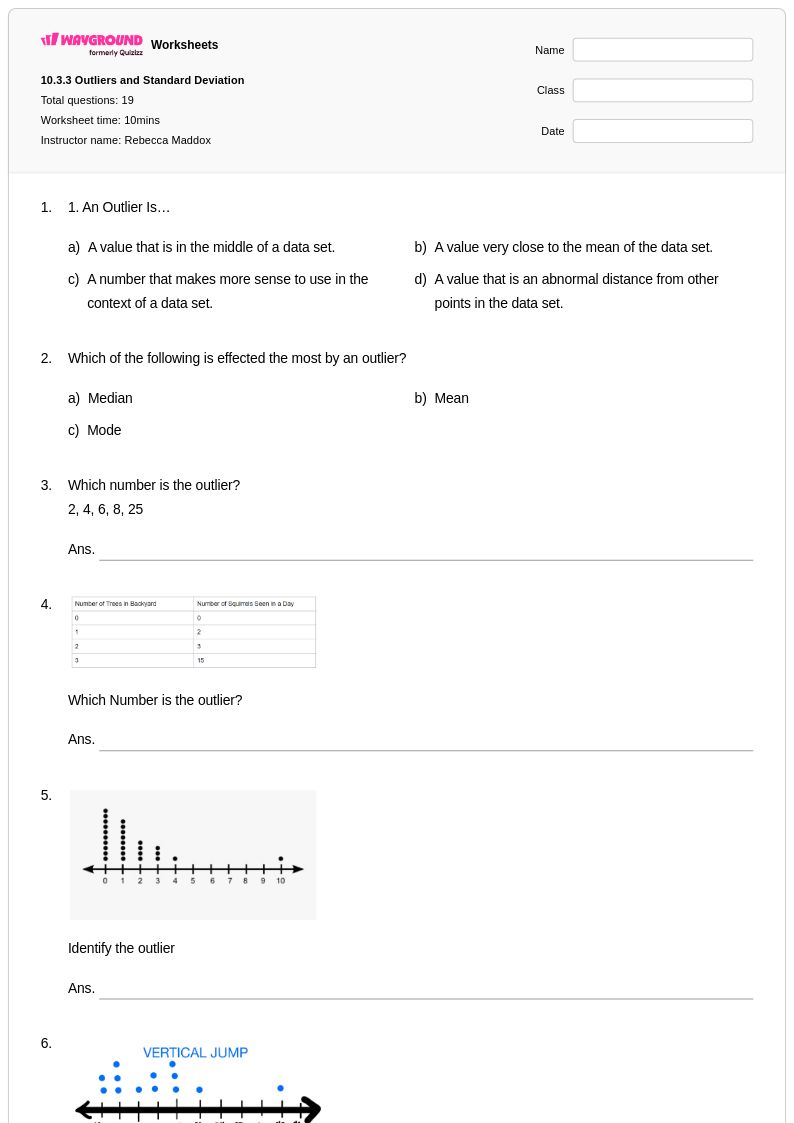
19 คิว
8th - 10th
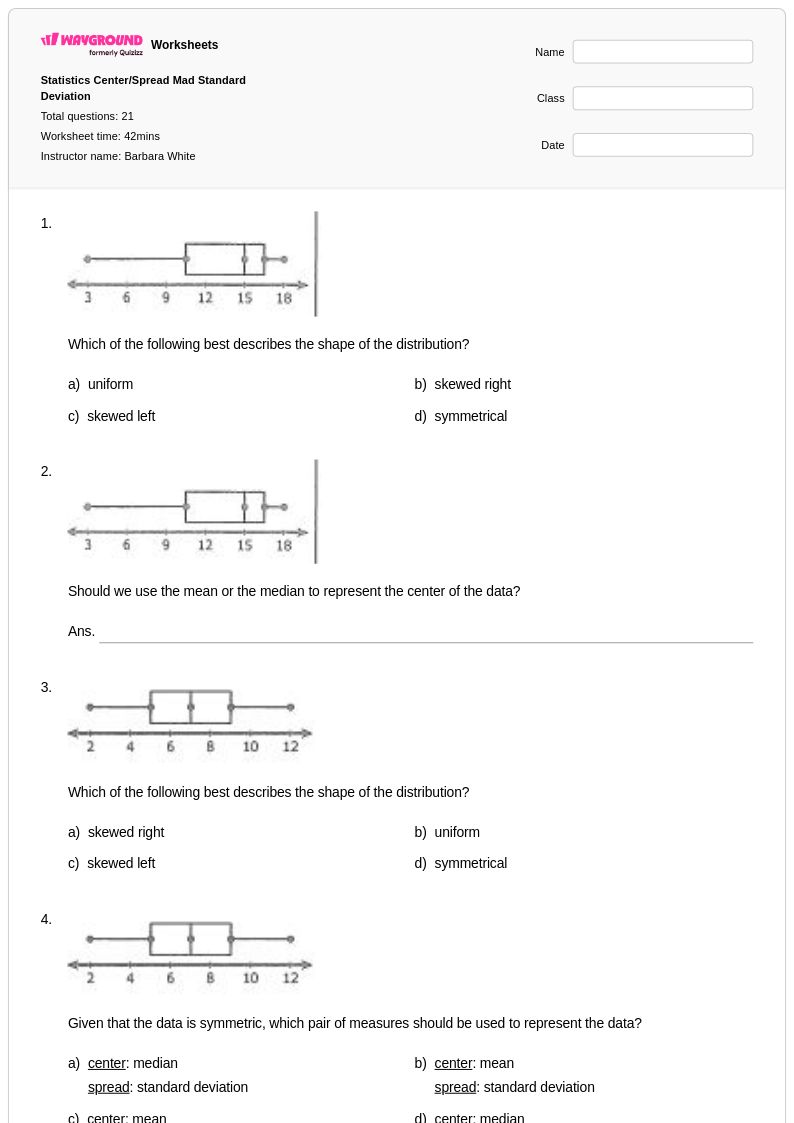
21 คิว
6th - 9th
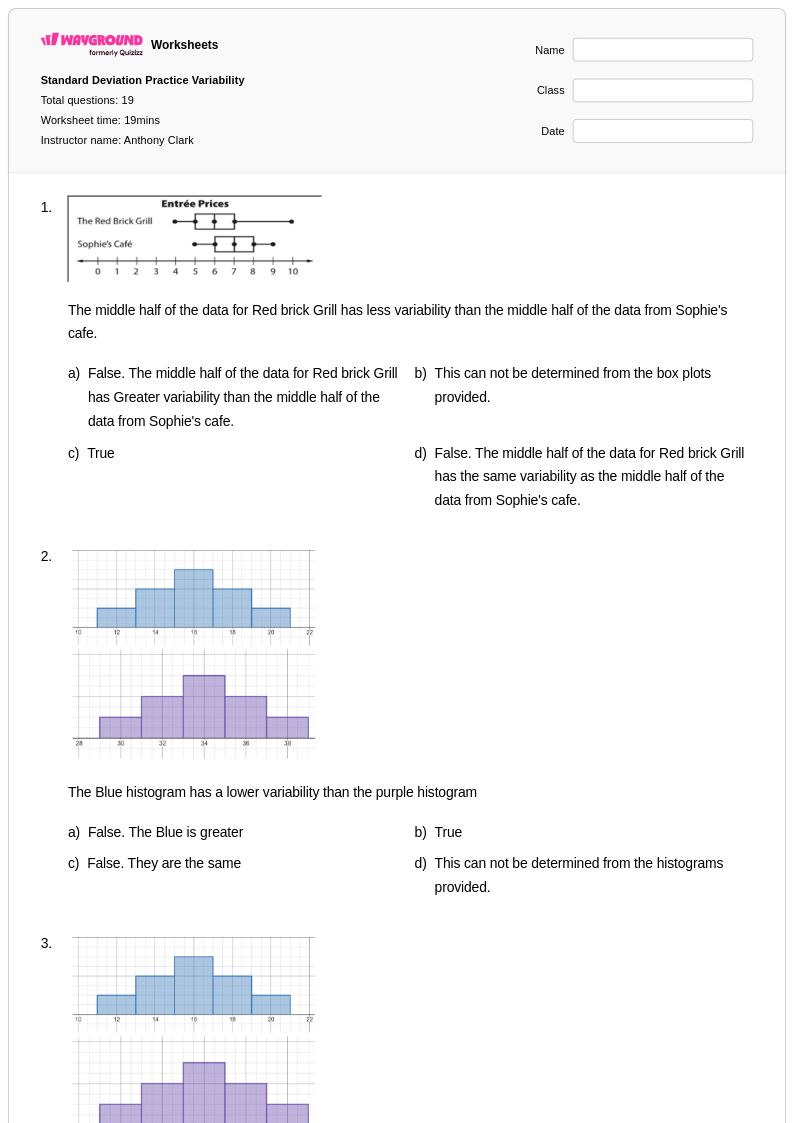
19 คิว
6th - Uni
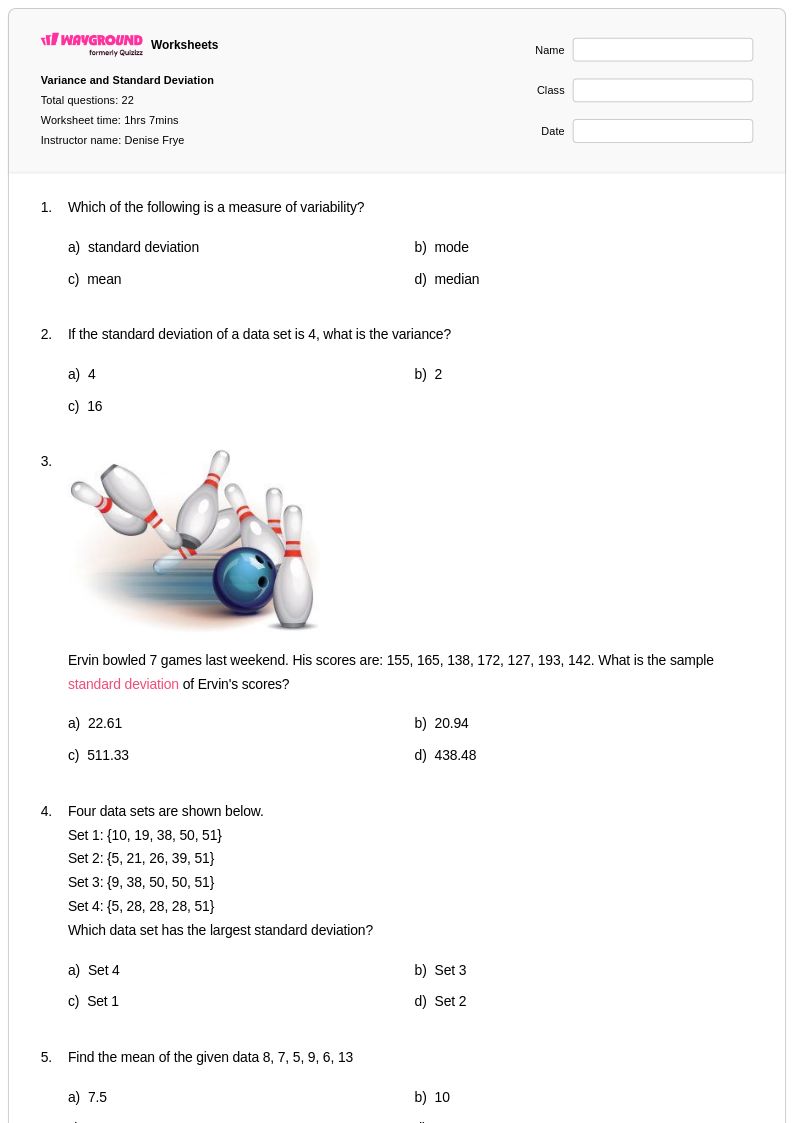
22 คิว
8th - 9th

15 คิว
8th
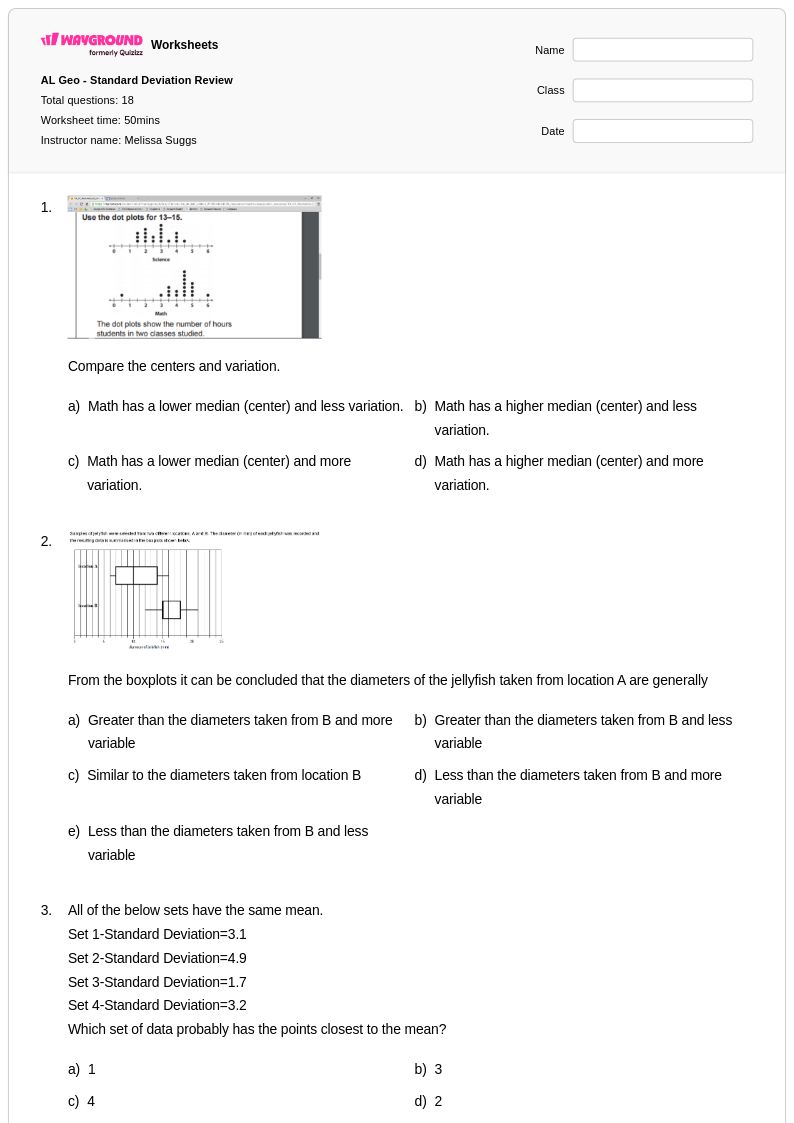
18 คิว
8th - 10th

14 คิว
8th
25 คิว
6th - 10th
20 คิว
7th - Uni
11 คิว
7th - 10th
20 คิว
7th - Uni
20 คิว
7th - Uni
21 คิว
6th - 9th
21 คิว
6th - 9th
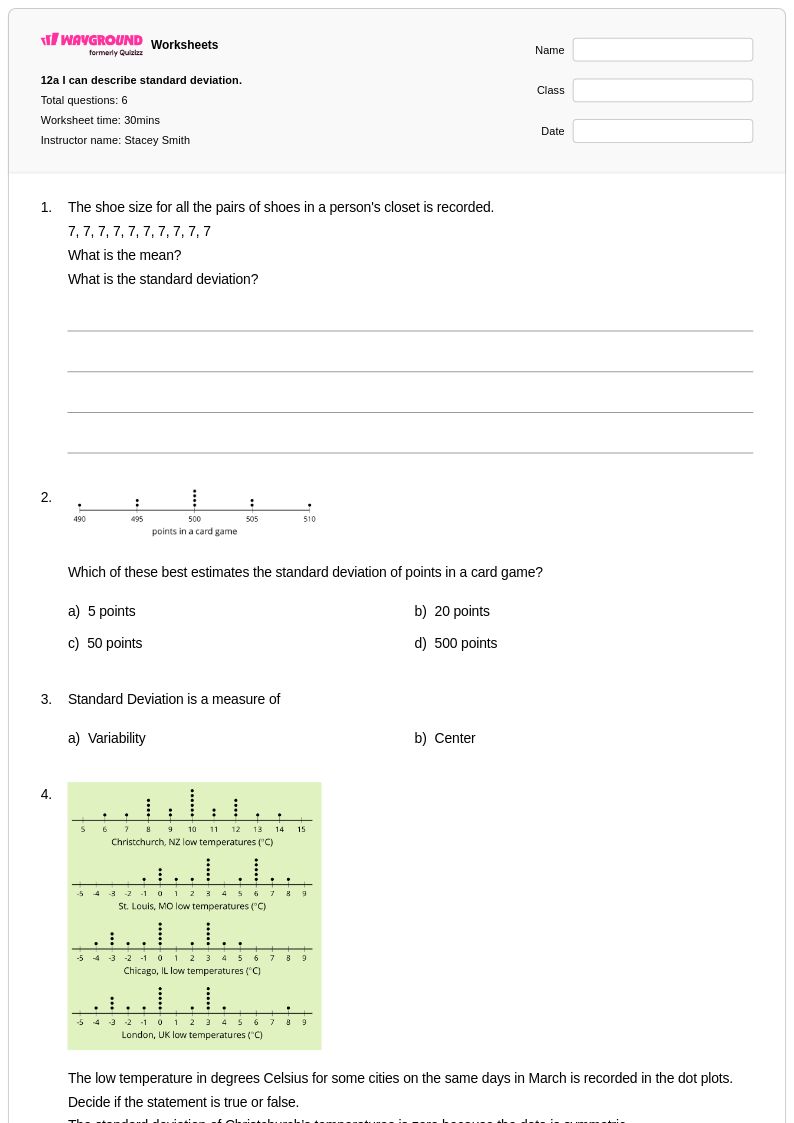
6 คิว
6th - 8th
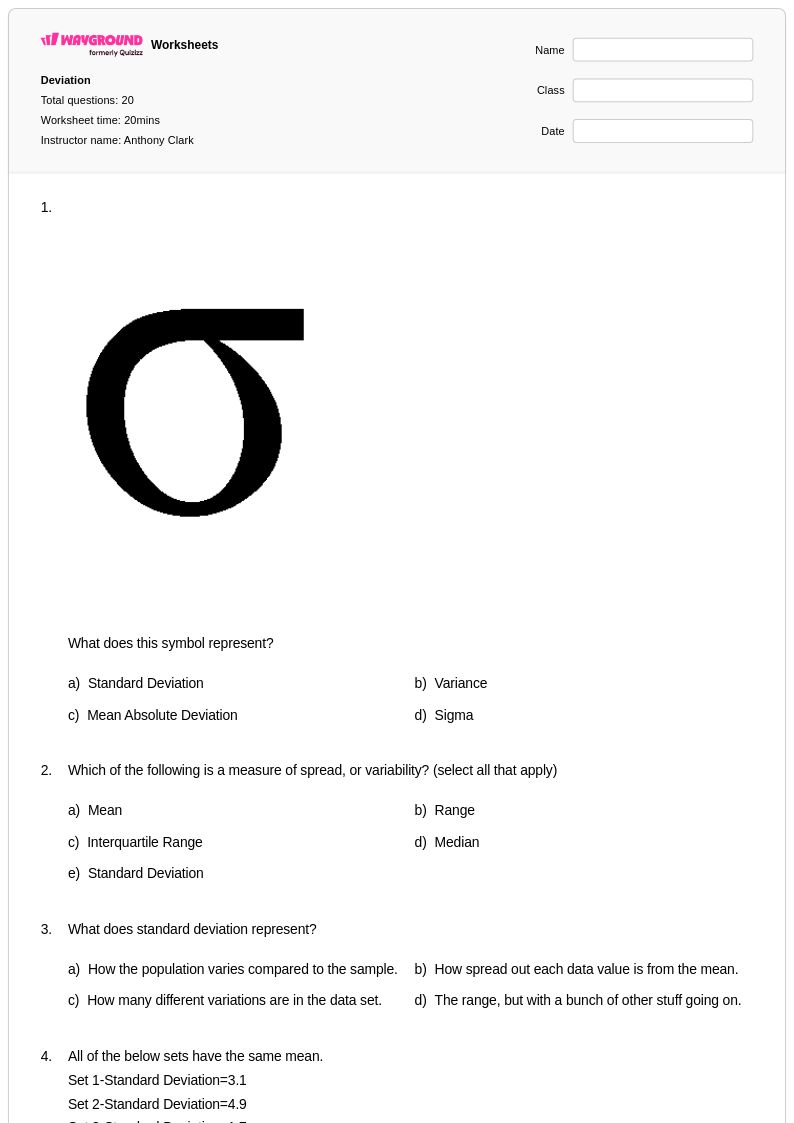
20 คิว
7th - Uni
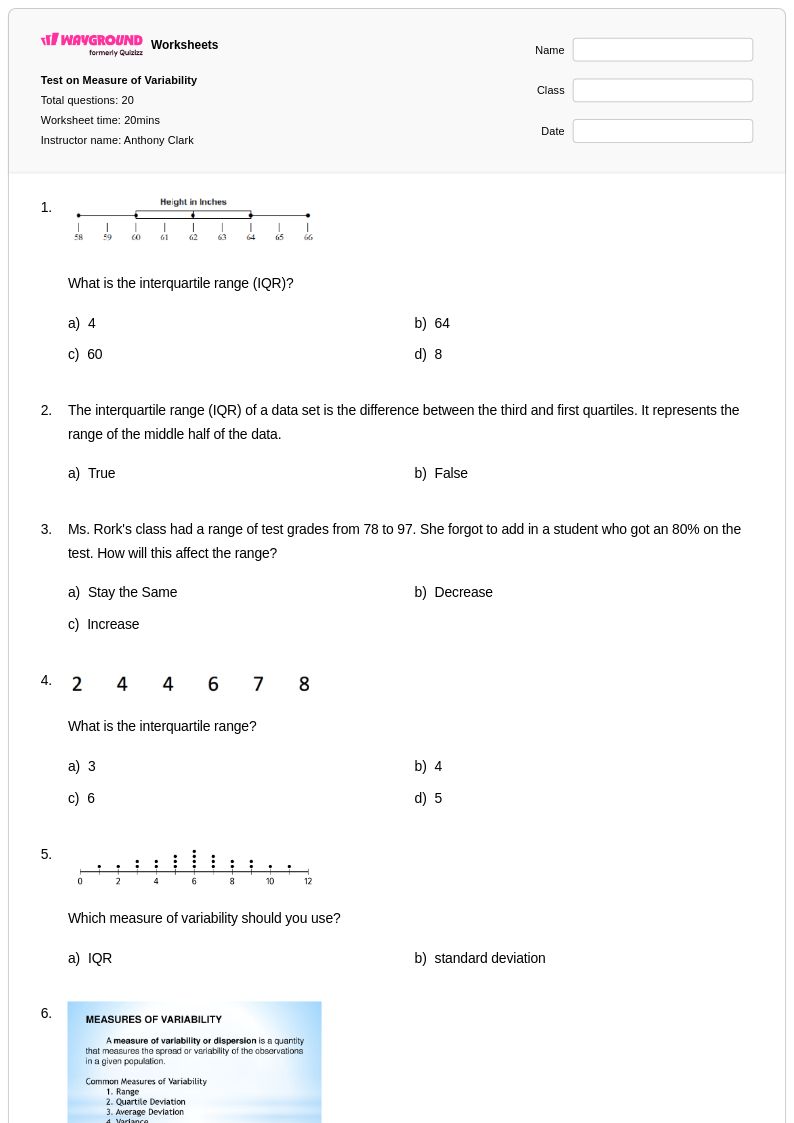
20 คิว
7th - Uni
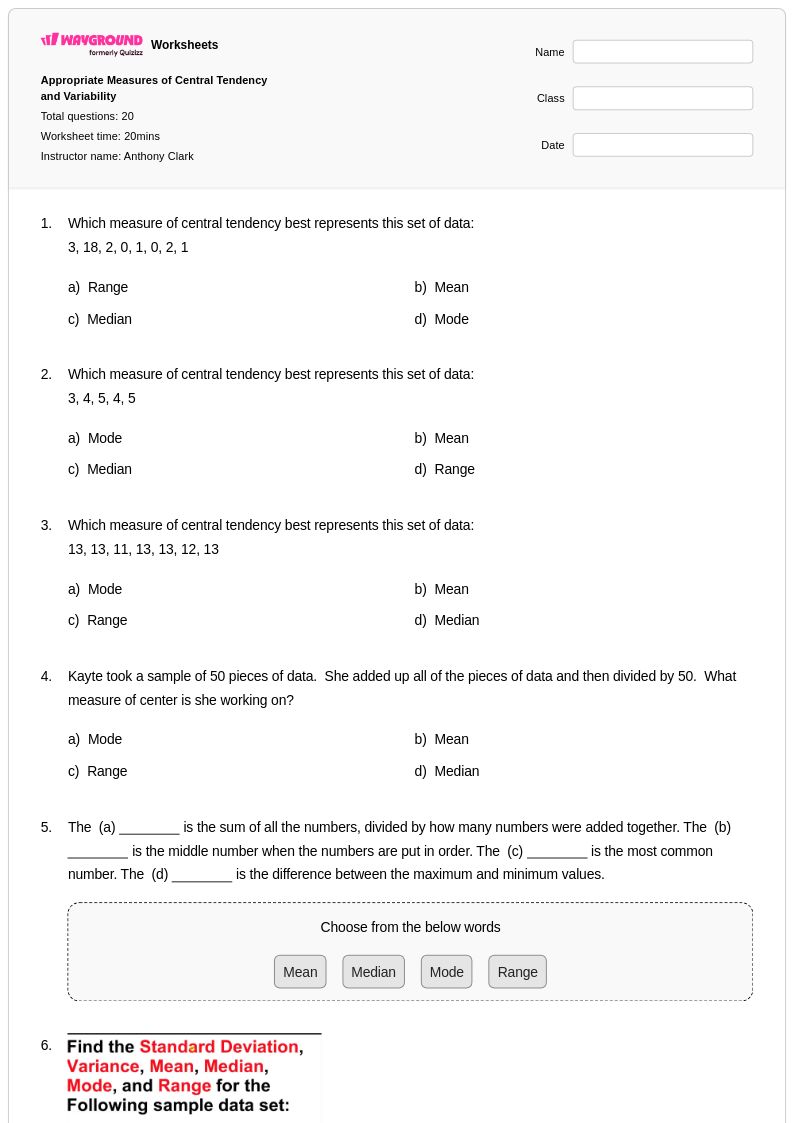
20 คิว
7th - Uni
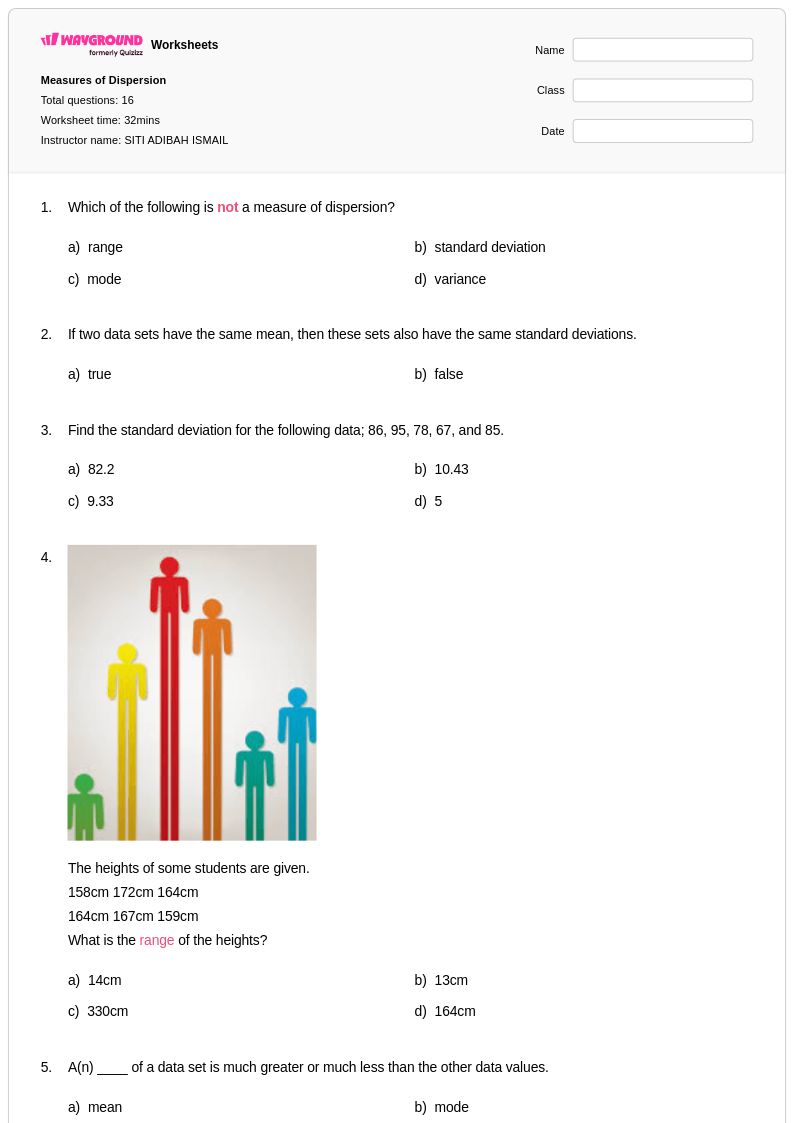
16 คิว
5th - 11th
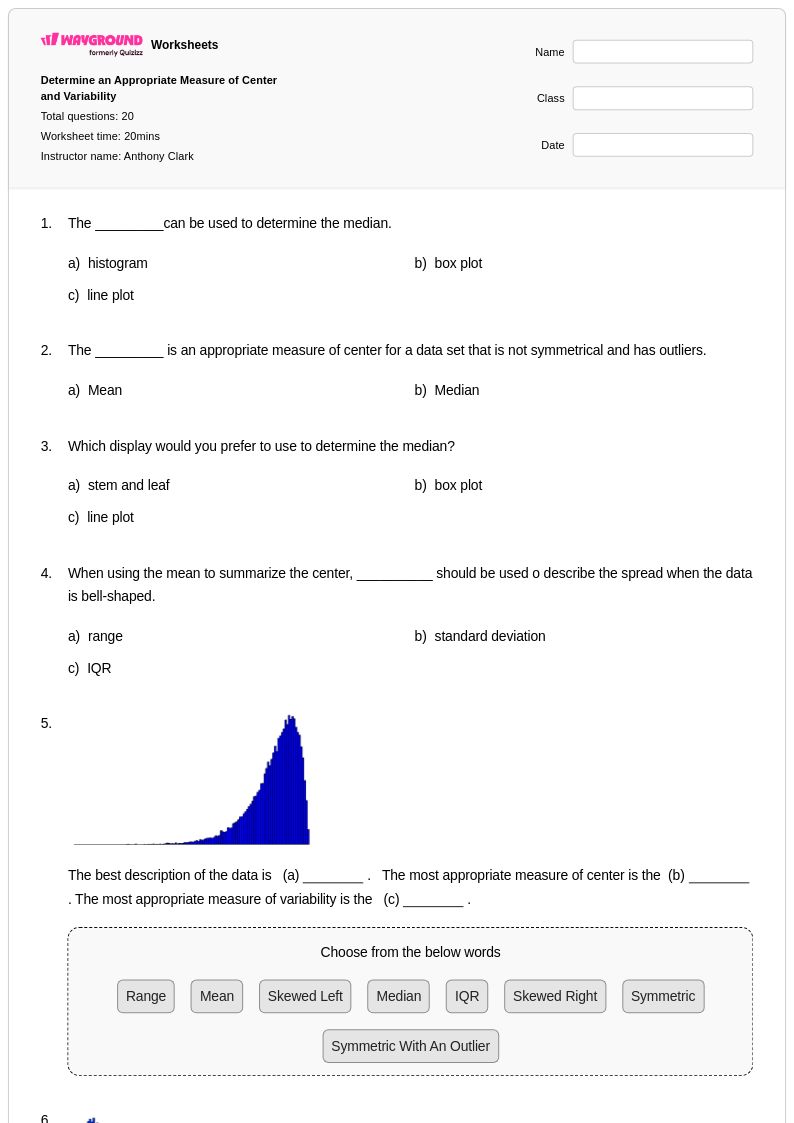
20 คิว
7th - Uni
สำรวจใบงานวิชาอื่นๆ สำหรับ class 8
Explore printable Standard Deviation worksheets for Class 8
Standard deviation worksheets for Class 8 students available through Wayground (formerly Quizizz) provide comprehensive practice with this fundamental statistical concept that measures how spread out data points are from the mean. These carefully designed resources help students master the essential skills of calculating standard deviation using both the population and sample formulas, interpreting what different standard deviation values reveal about data sets, and applying this knowledge to real-world scenarios involving variability in everything from test scores to manufacturing quality control. Each worksheet collection includes detailed answer keys that guide students through step-by-step solutions, while the free printable format and accompanying practice problems ensure students can work through multiple examples to solidify their understanding of this critical statistical measure.
Wayground's extensive library of teacher-created standard deviation resources supports educators with millions of high-quality materials that can be easily located through powerful search and filtering tools designed specifically for Class 8 mathematics instruction. The platform's standards-aligned content ensures that worksheets meet curriculum requirements while offering robust differentiation tools that allow teachers to modify difficulty levels and problem types to match diverse student needs. Teachers can seamlessly customize these resources for both remediation and enrichment purposes, accessing materials in flexible digital formats or downloading them as PDF files for traditional classroom distribution. This comprehensive approach to worksheet management streamlines lesson planning while providing targeted skill practice opportunities that help students build confidence and competency in statistical analysis and data interpretation.
FAQs
Do 8th graders learn to calculate standard deviation?
How can I connect the idea of 'spread' to 8th-grade statistics?
What practice problems are appropriate for 8th graders on data spread?
How does this fit with 8th-grade Common Core math standards?
How can I use this worksheet with my 8th graders?
What are common misconceptions when 8th graders analyze scatter plots?