Free Printable Climatograph Worksheets for Grade 8
Grade 8 climatograph worksheets from Wayground help students master interpreting climate data through engaging printables and practice problems that teach how to read temperature and precipitation graphs with comprehensive answer keys.
Explore printable Climatograph worksheets for Grade 8
Climatograph worksheets for Grade 8 Earth & Space Science available through Wayground (formerly Quizizz) provide students with essential practice in interpreting and analyzing climate data visualization. These comprehensive worksheets strengthen critical scientific skills including data analysis, graph interpretation, pattern recognition, and climate classification as students learn to read temperature and precipitation data from various global locations. Each worksheet collection includes detailed answer keys and is available as free printable pdf resources, featuring practice problems that guide students through the process of constructing and analyzing climatographs while developing their understanding of how climate patterns vary across different biomes and geographic regions.
Wayground (formerly Quizizz) supports educators with an extensive collection of teacher-created climatograph resources, drawing from millions of high-quality materials that can be easily accessed through robust search and filtering capabilities. These Grade 8 Earth & Space Science worksheets align with educational standards and include powerful differentiation tools that allow teachers to customize content for diverse learning needs, whether addressing remediation for struggling students or providing enrichment opportunities for advanced learners. Available in both printable and digital pdf formats, these flexible resources streamline lesson planning while offering targeted skill practice that helps students master the interpretation of climate data, understand global weather patterns, and develop proficiency in scientific graph analysis essential for earth science literacy.
FAQs
How do I teach students to read a climatograph?
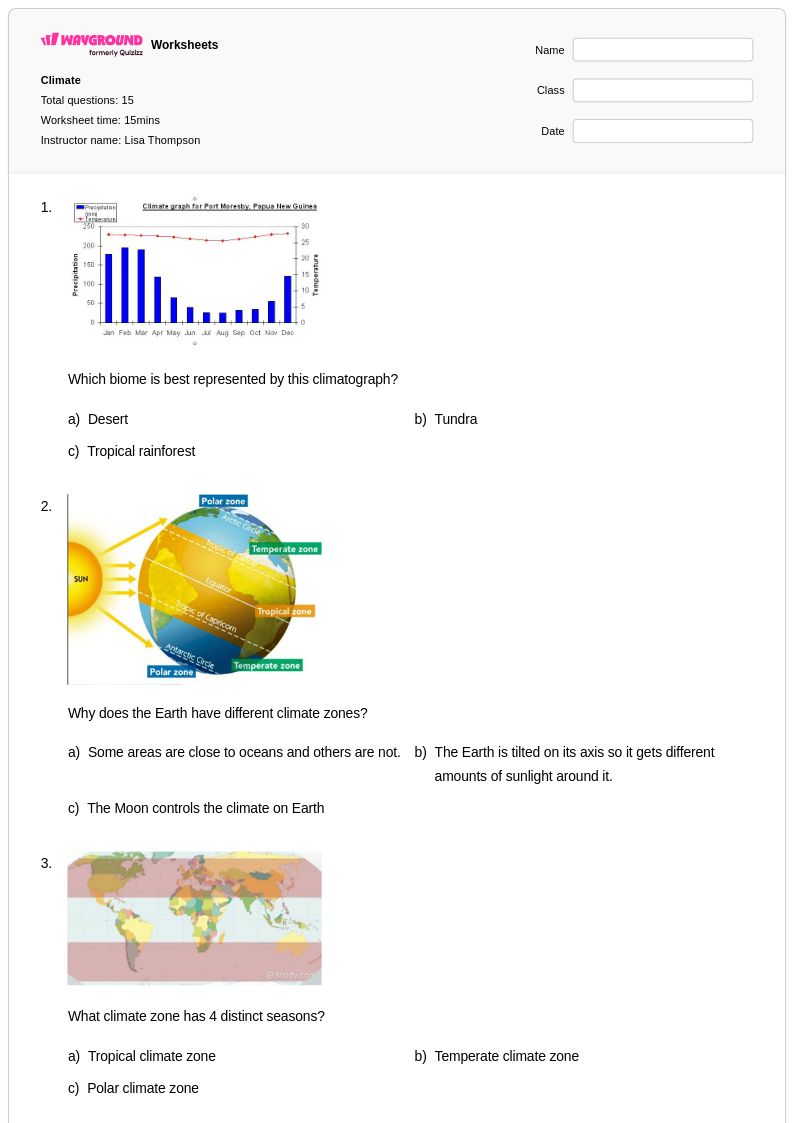
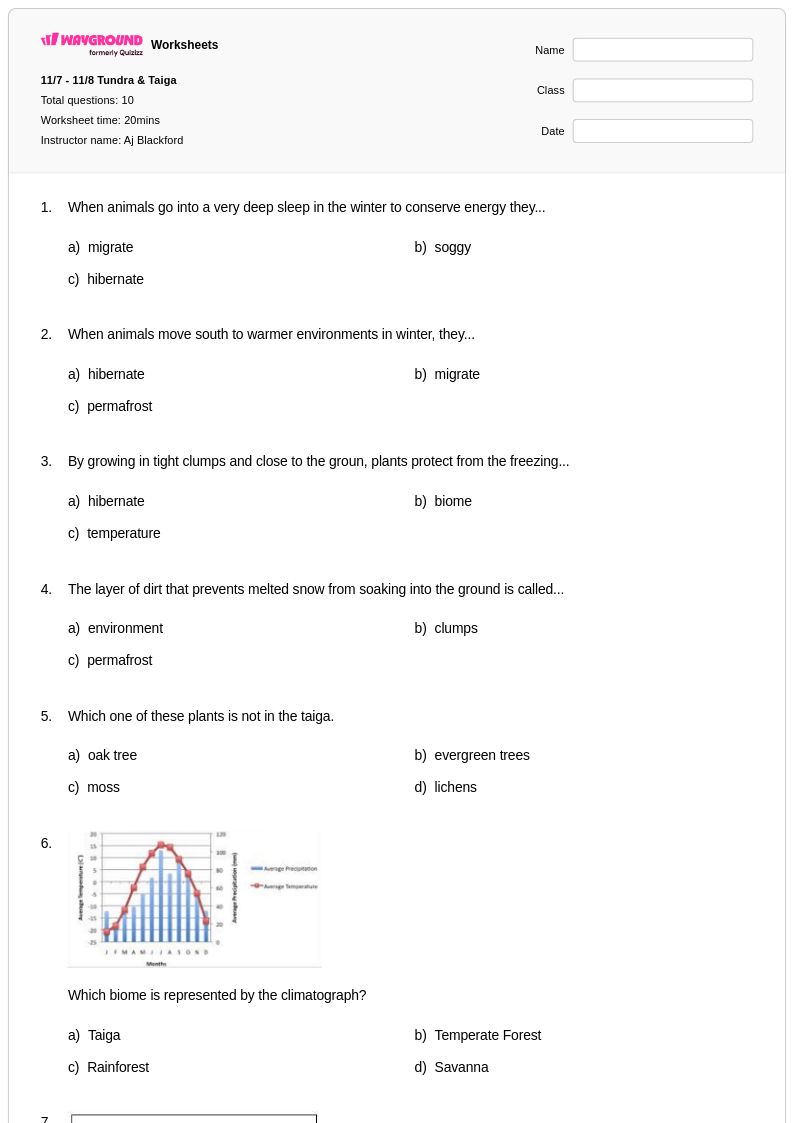
Start by explaining that a climatograph uses a dual-axis graph to display two climate variables simultaneously: temperature is plotted as a line graph on one y-axis, and precipitation is shown as bar graphs on the other. Walk students through identifying the x-axis (months of the year), then practice reading individual data points before asking them to describe seasonal patterns. Connecting climate patterns to biomes the students already know — such as linking a dry summer pattern to a Mediterranean climate — helps anchor the abstract graph to real-world geography.
What exercises help students practice interpreting climatographs?
Effective practice tasks include calculating annual temperature range, identifying the wettest and driest months, and classifying a climate type based on the graph's pattern. Comparing two climatographs side by side from different regions challenges students to make evidence-based inferences about vegetation, ecosystems, and human activity. Varied practice problems that require students to extract specific data points, identify trends, and draw conclusions build the layered comprehension skills climatograph analysis demands.
What common mistakes do students make when analyzing climatographs?
The most frequent error is confusing which axis represents temperature and which represents precipitation, especially when scales differ across graphs. Students also struggle to distinguish between the two y-axes and may misread bar heights by referencing the wrong scale. Another common misconception is assuming that high temperatures and high precipitation always occur together, which does not hold for climates like Mediterranean or semi-arid regions where seasonal patterns are inverse.
How can I use climatograph worksheets to support different skill levels in my class?
For students new to graph analysis, begin with single-region climatographs that have clearly labeled axes and guided questions focused on reading individual values. More advanced learners benefit from multi-region comparison tasks that require pattern recognition and climate classification without scaffolding. On Wayground, teachers can apply accommodations such as reduced answer choices to lower cognitive load for struggling students, or enable Read Aloud so that questions are accessible to students who need additional reading support, all without disrupting the experience of other students.
How do I use Wayground's climatograph worksheets in my classroom?
Wayground's climatograph worksheets are available as free printable PDFs for traditional classroom use and in interactive digital formats for technology-integrated environments, including the option to host them as a quiz directly on Wayground. Each worksheet includes a complete answer key, making them practical for independent practice, homework, or formative assessment. The digital format is especially useful for remote or hybrid settings where students need to engage with climate data analysis outside the physical classroom.
How do climatograph worksheets connect to broader Earth science curriculum?
Climatographs sit at the intersection of data literacy and Earth science, making them a natural fit for units on climate zones, biomes, and geographic patterns. Students who can read and interpret climatographs develop transferable skills in dual-axis graph analysis and pattern recognition that apply across other scientific contexts. Connecting climatograph data to biome characteristics and geographic locations reinforces how climate shapes ecosystems and human settlement, giving the skill clear relevance within a broader science curriculum.