NGPF 8.3-8.4 Credit History and Histograms and Dot Plots - Printable Histogram-interpretation Worksheets Grade 9 - Quizizz
NGPF 8.3-8.4 Credit History and Histograms and Dot Plots

28 Q

9th - 12th

Algebra 1P Quiz on Histograms - Printable Histogram-interpretation Worksheets Grade 9 - Quizizz
Algebra 1P Quiz on Histograms

20 Q

9th - 12th

Dot plot, Histogram, Box & whisker Quiz - Printable Histogram-interpretation Worksheets Grade 9 - Quizizz
Dot plot, Histogram, Box & whisker Quiz

25 Q

9th - 12th

Linear Interpretation - Printable Histogram-interpretation Worksheets Grade 9 - Quizizz
Linear Interpretation

12 Q

9th - Uni

Percentages and Histograms - Printable Histogram-interpretation Worksheets Grade 9 - Quizizz
Percentages and Histograms

15 Q

9th - Uni

Histogram and Making inferences - Printable Histogram-interpretation Worksheets Grade 9 - Quizizz
Histogram and Making inferences

16 Q

9th - 12th

Histogram and Dot Plot Assignment - Printable Histogram-interpretation Worksheets Grade 9 - Quizizz
Histogram and Dot Plot Assignment

12 Q

9th

17.2 Data Displays - Printable Histogram-interpretation Worksheets Grade 9 - Quizizz
17.2 Data Displays

14 Q

9th

Data Analysis EOC (2024) - Printable Histogram-interpretation Worksheets Grade 9 - Quizizz
Data Analysis EOC (2024)

25 Q

9th - Uni

Statistical Questions and Data Distribution - Printable Histogram-interpretation Worksheets Grade 9 - Quizizz
Statistical Questions and Data Distribution

19 Q

6th - Uni

Algebra Semester 1: Data & Statistics - Printable Histogram-interpretation Worksheets Grade 9 - Quizizz
Algebra Semester 1: Data & Statistics

20 Q

9th

Distributions of Data Quiz Review - Printable Histogram-interpretation Worksheets Grade 9 - Quizizz
Distributions of Data Quiz Review

10 Q

9th - 12th

UNIT 1 REVIEW - Printable Histogram-interpretation Worksheets Grade 9 - Quizizz
UNIT 1 REVIEW

18 Q

9th

Algebra 1 Unit 12 Lesson 1 Homework - Printable Histogram-interpretation Worksheets Grade 9 - Quizizz
Algebra 1 Unit 12 Lesson 1 Homework

13 Q

6th - Uni

Intro to Data and Statistics - Printable Histogram-interpretation Worksheets Grade 9 - Quizizz
Intro to Data and Statistics

10 Q

9th

Unit 16 and 17 Review - Printable Histogram-interpretation Worksheets Grade 9 - Quizizz
Unit 16 and 17 Review

20 Q

9th

9.1 - Intro to Statistics - Printable Histogram-interpretation Worksheets Grade 9 - Quizizz
9.1 - Intro to Statistics

14 Q

9th - 12th

17.3 Analyzing Data - Printable Histogram-interpretation Worksheets Grade 9 - Quizizz
17.3 Analyzing Data

15 Q

9th

Linear Functions Slope Interpretation - Printable Histogram-interpretation Worksheets Grade 9 - Quizizz
Linear Functions Slope Interpretation

15 Q

9th - Uni

Alg 1, Topic 11 Review - Printable Histogram-interpretation Worksheets Grade 9 - Quizizz
Alg 1, Topic 11 Review

14 Q

9th - 12th

Correlation Coefficient from Table of Values - Printable Histogram-interpretation Worksheets Grade 9 - Quizizz
Correlation Coefficient from Table of Values

14 Q

9th - Uni

Unit 8 - Data Analysis Assessment - Printable Histogram-interpretation Worksheets Grade 9 - Quizizz
Unit 8 - Data Analysis Assessment

20 Q

9th - 10th

Chapter 2: Exploring Data with Tables & Graphs - Printable Histogram-interpretation Worksheets Grade 9 - Quizizz
Chapter 2: Exploring Data with Tables & Graphs

20 Q

9th - 12th

A1 - Unit 1 Review | Describing Data - Printable Histogram-interpretation Worksheets Grade 9 - Quizizz
A1 - Unit 1 Review | Describing Data

12 Q

9th - 12th

Explore printable Histogram Interpretation worksheets for Grade 9

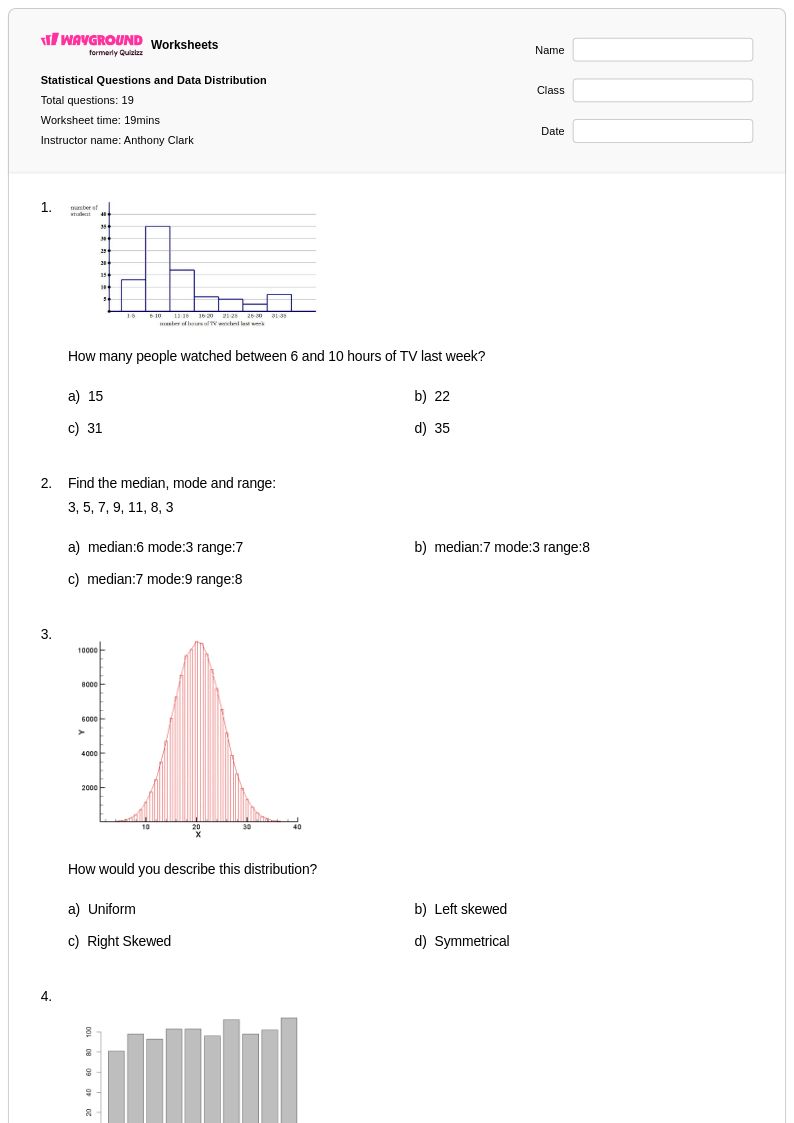
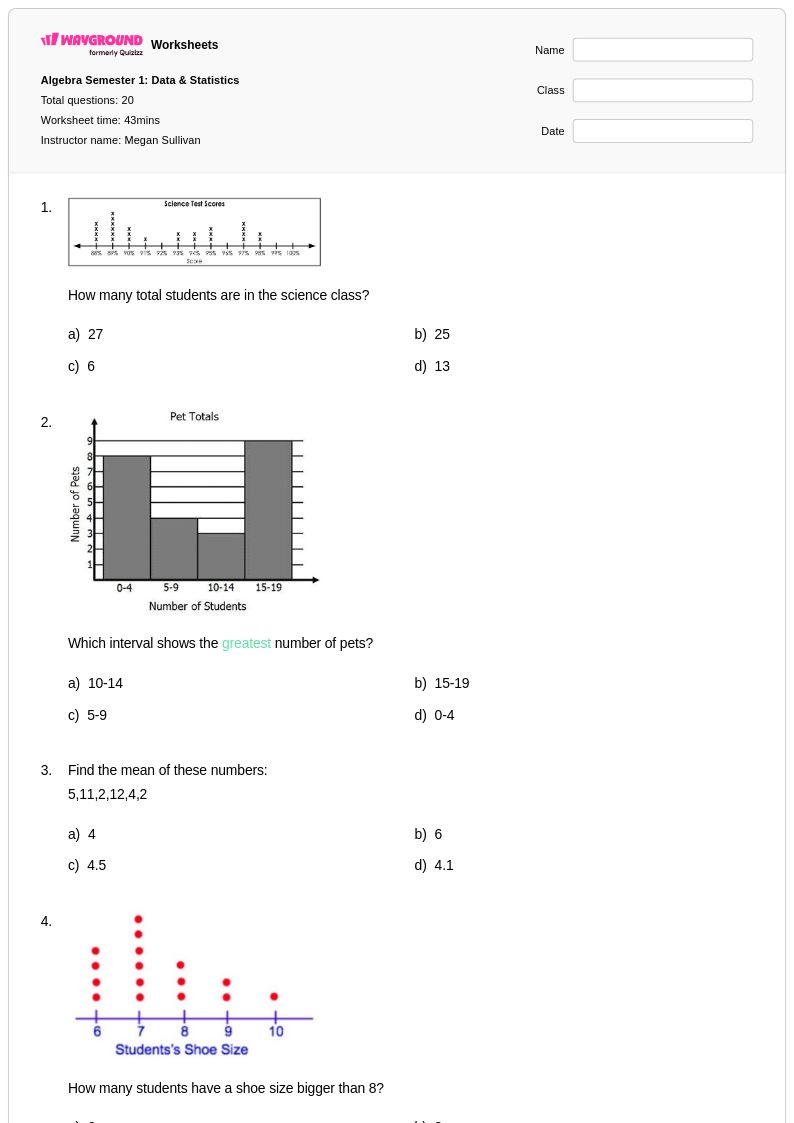
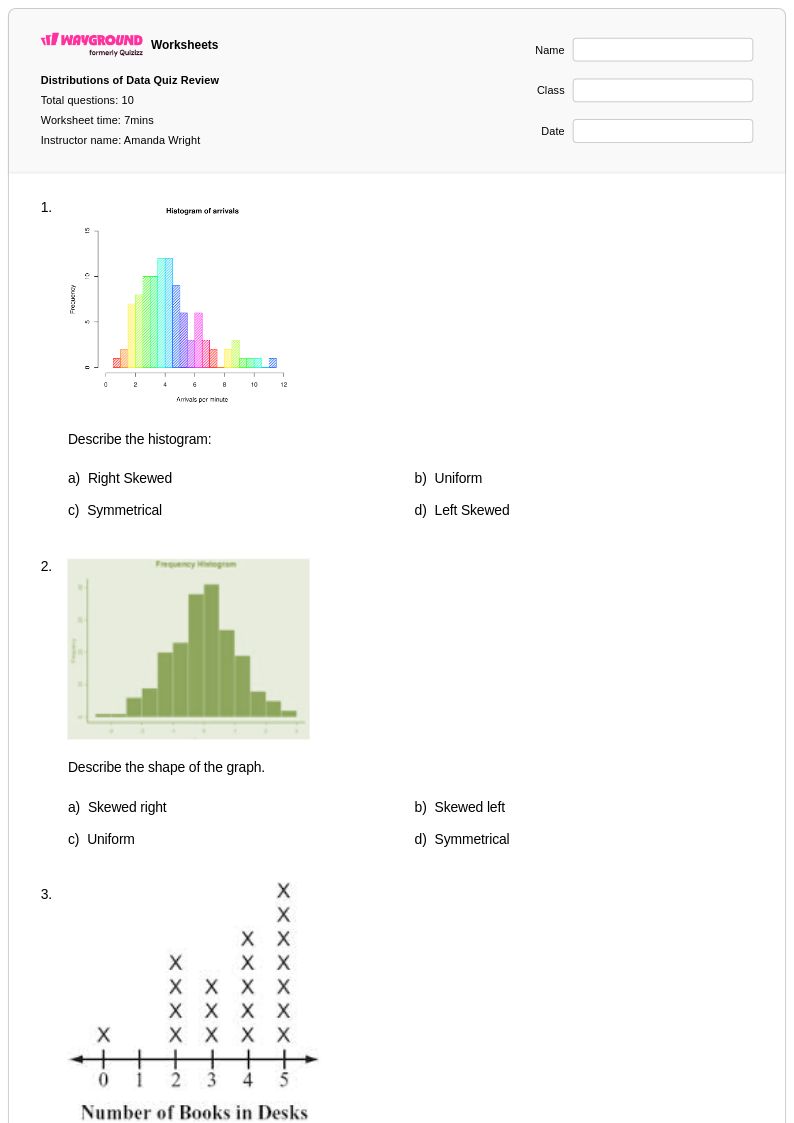
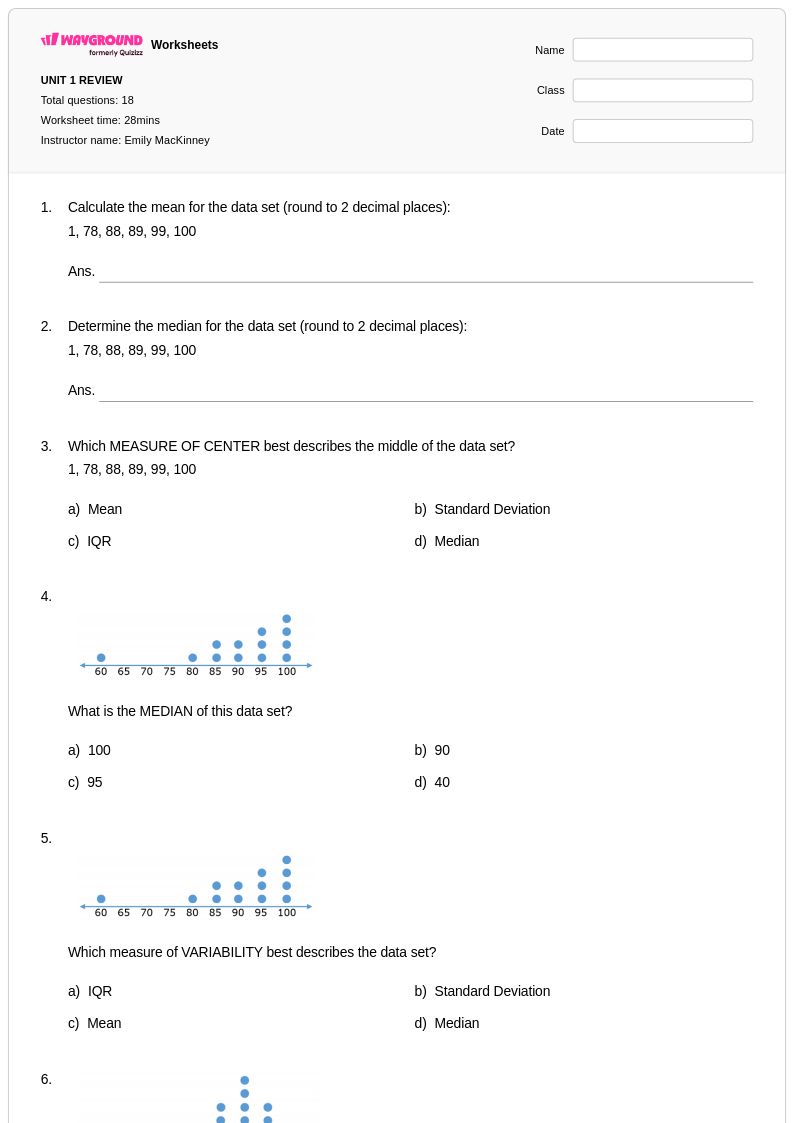
Histogram interpretation worksheets for Grade 9 mathematics provide students with essential practice in analyzing and understanding one of the most fundamental data visualization tools in statistics. These comprehensive worksheets available through Wayground (formerly Quizizz) focus on developing critical skills such as reading histogram axes, determining frequency distributions, identifying data patterns, calculating measures of central tendency from grouped data, and making informed conclusions about data sets. Students work through carefully designed practice problems that progress from basic histogram reading to complex interpretation tasks, strengthening their ability to extract meaningful information from visual data representations. Each worksheet comes with a detailed answer key and is available as a free printable pdf, making it easy for educators to assess student understanding and provide targeted feedback on this crucial mathematical concept.

Wayground (formerly Quizizz) empowers mathematics teachers with access to millions of teacher-created histogram interpretation resources specifically designed for Grade 9 students and aligned with curriculum standards. The platform's robust search and filtering capabilities allow educators to quickly locate worksheets that match their specific instructional needs, whether focusing on basic frequency reading or advanced statistical analysis. Teachers can customize these materials to support differentiation in their classrooms, adapting content for remediation or enrichment as needed, while the flexible format options include both digital assignments and printable pdf versions for traditional paper-based practice. This extensive collection streamlines lesson planning by providing ready-to-use materials that support systematic skill development, helping teachers effectively guide students through the complexities of data interpretation while building the analytical thinking skills essential for advanced mathematics and real-world statistical literacy.