
8 Q
3rd
17 Q
3rd

8 Q
3rd
12 Q
3rd - 5th
10 Q
3rd
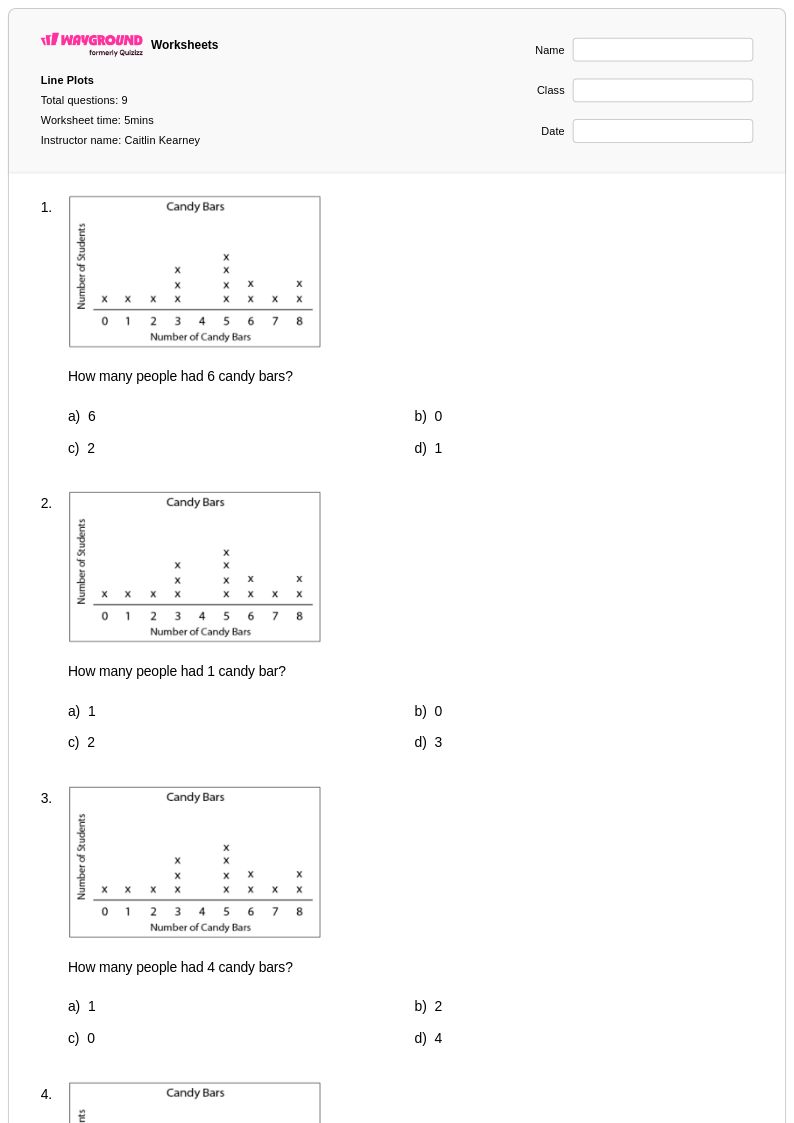
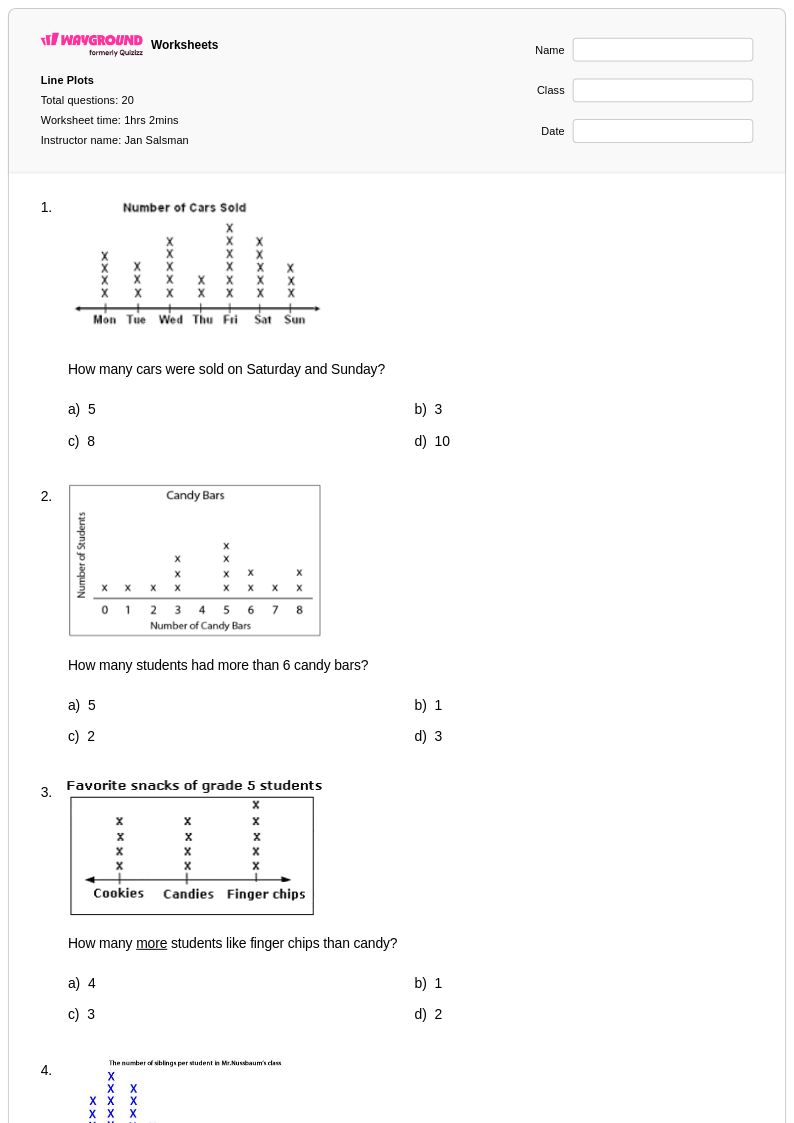
9 Q
1st - 3rd
20 Q
3rd
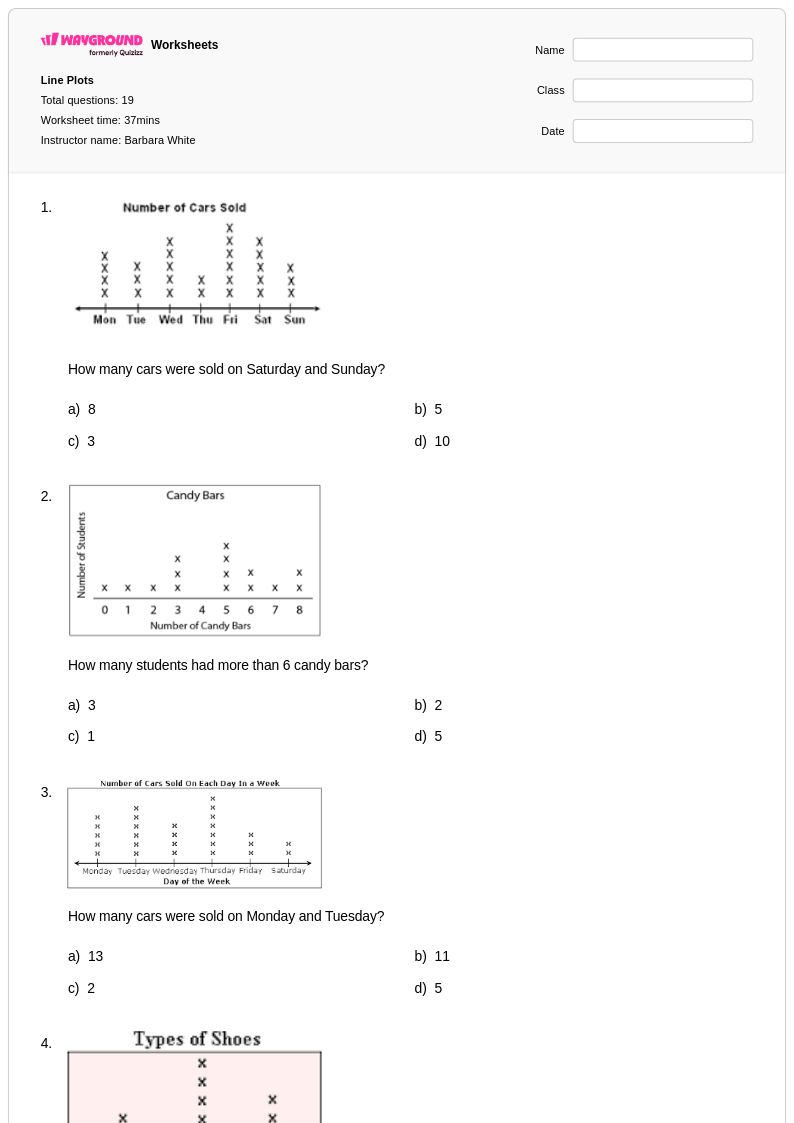
19 Q
3rd
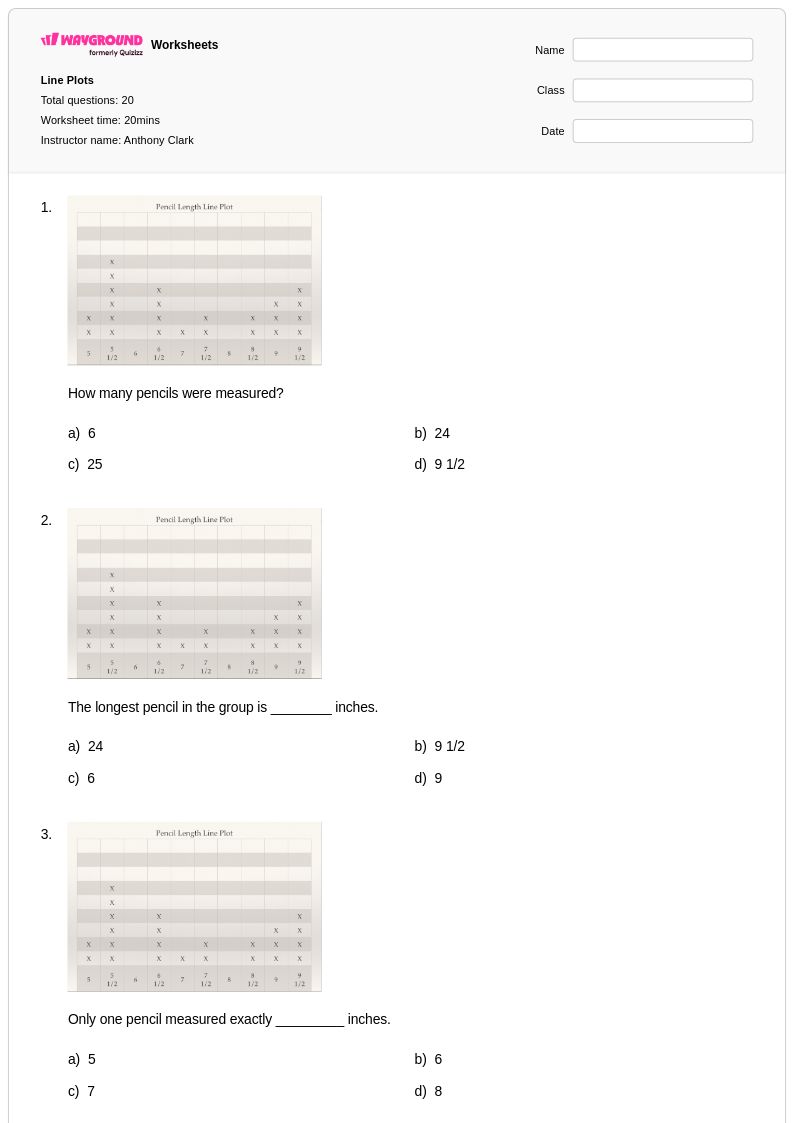
20 Q
2nd - Uni
20 Q
3rd - Uni
15 Q
1st - 3rd
27 Q
3rd

27 Q
3rd
7 Q
3rd - 6th
13 Q
3rd - Uni
14 Q
3rd - Uni

7 Q
3rd
10 Q
3rd
15 Q
3rd - Uni
27 Q
3rd
12 Q
3rd - 4th
20 Q
3rd - Uni
11 Q
3rd
15 Q
3rd
Explore Other Subject Worksheets for grade 3
Explore printable Line Plots worksheets for Grade 3
Line plots serve as a fundamental introduction to data visualization for Grade 3 students, and Wayground's comprehensive collection of line plot worksheets provides educators with expertly crafted resources to build these essential mathematical skills. These worksheets guide young learners through the process of organizing, interpreting, and displaying data using line plots, helping students understand how to represent information visually while developing critical thinking and analytical abilities. Each worksheet includes carefully structured practice problems that progress from basic data plotting to more complex interpretation tasks, complete with answer keys that enable both independent practice and guided instruction. The free printable resources are available in convenient PDF format, making them accessible for classroom use, homework assignments, or targeted skill reinforcement.
Wayground, formerly Quizizz, empowers educators with millions of teacher-created line plot worksheets that can be easily discovered through robust search and filtering capabilities, ensuring alignment with specific learning objectives and curriculum standards. The platform's differentiation tools allow teachers to customize worksheets based on individual student needs, whether for remediation of foundational concepts or enrichment of advanced learners who are ready for more challenging data interpretation tasks. These resources are available in both printable and digital formats, including downloadable PDFs, providing flexibility for various instructional settings and learning preferences. Teachers can efficiently plan lessons, assess student understanding, and provide targeted practice opportunities that strengthen students' ability to create, read, and analyze line plots while building confidence in mathematical reasoning and data literacy skills.