
20Q
8th - Uni
15Q
8th - Uni
15Q
9th - Uni
20Q
8th - Uni
15Q
8th - Uni
9Q
7th - 12th
20Q
11th
19Q
11th - Uni
20Q
8th - Uni
20Q
9th - Uni
20Q
9th - 12th
28Q
9th - 12th
11Q
9th - 12th
20Q
8th - Uni
20Q
9th - Uni
15Q
9th - 12th
20Q
9th - 12th
9Q
9th - 12th
29Q
9th - 12th
21Q
9th - 12th
18Q
7th - Uni
24Q
9th - 12th
40Q
9th - 12th
20Q
9th - Uni
Explore planilhas Scatter Plot Correlation por notas
Explore outras planilhas de assuntos para grade 11
Explore printable Scatter Plot Correlation worksheets for Grade 11
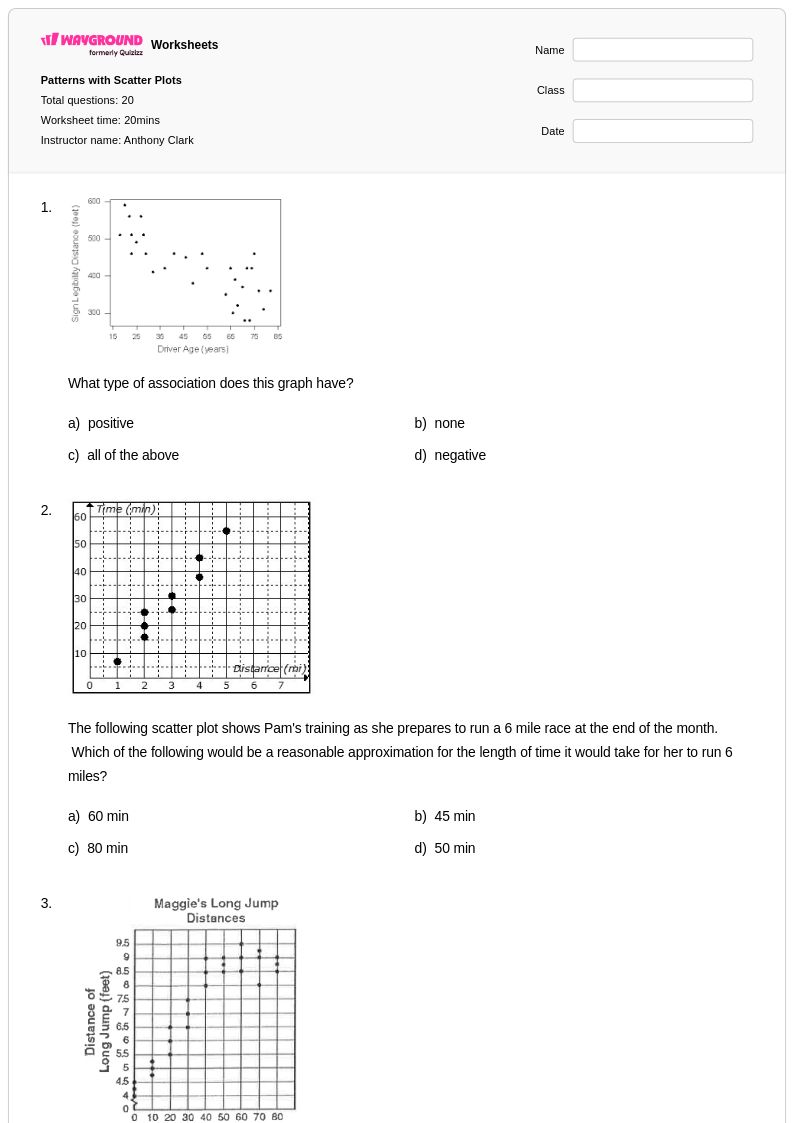
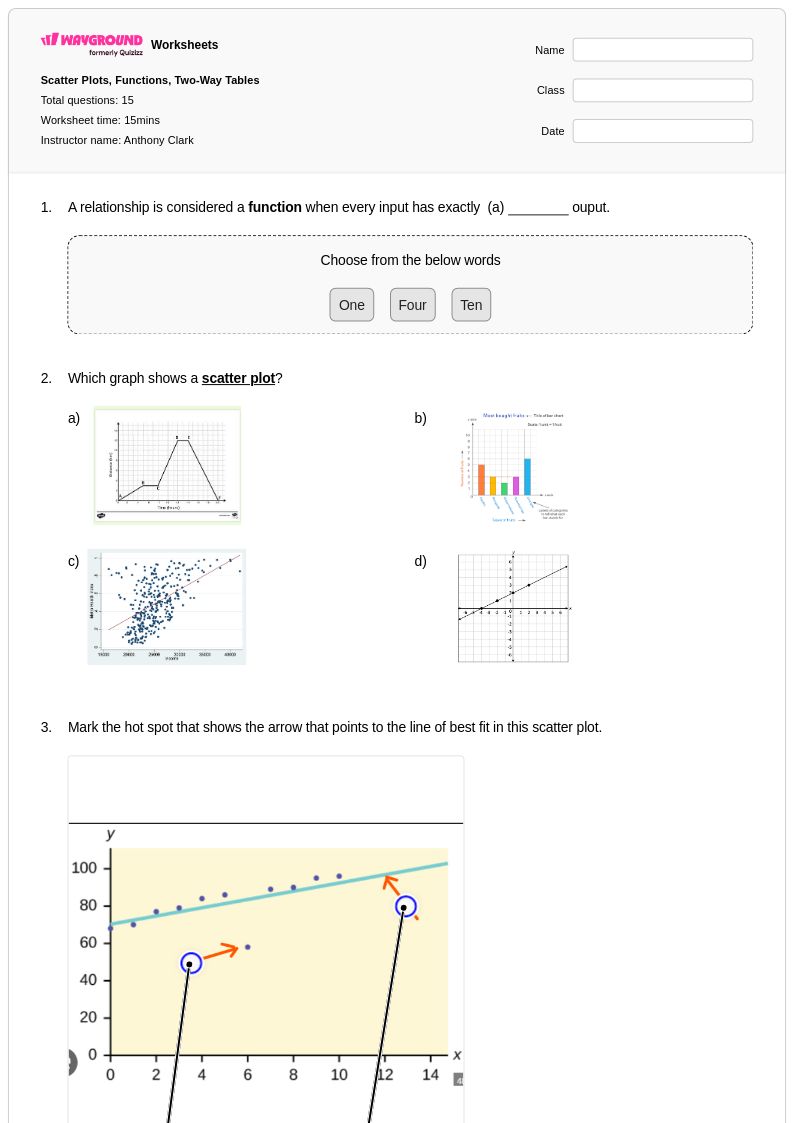
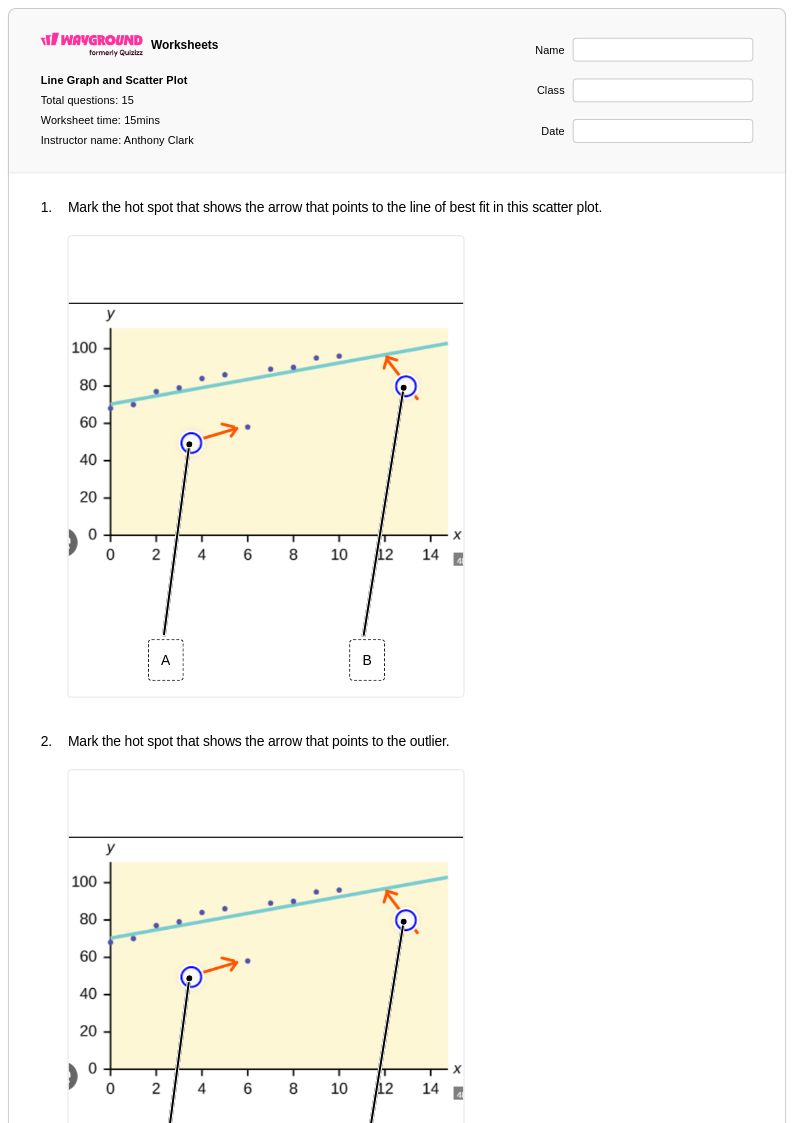
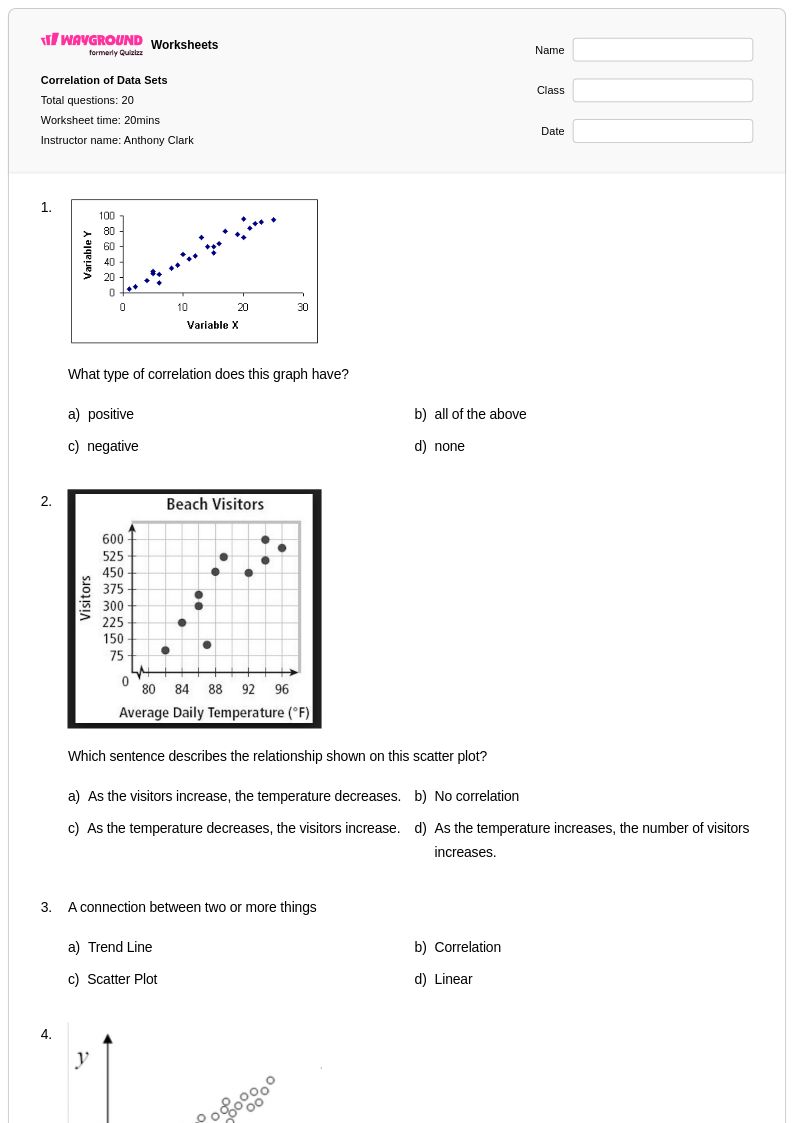
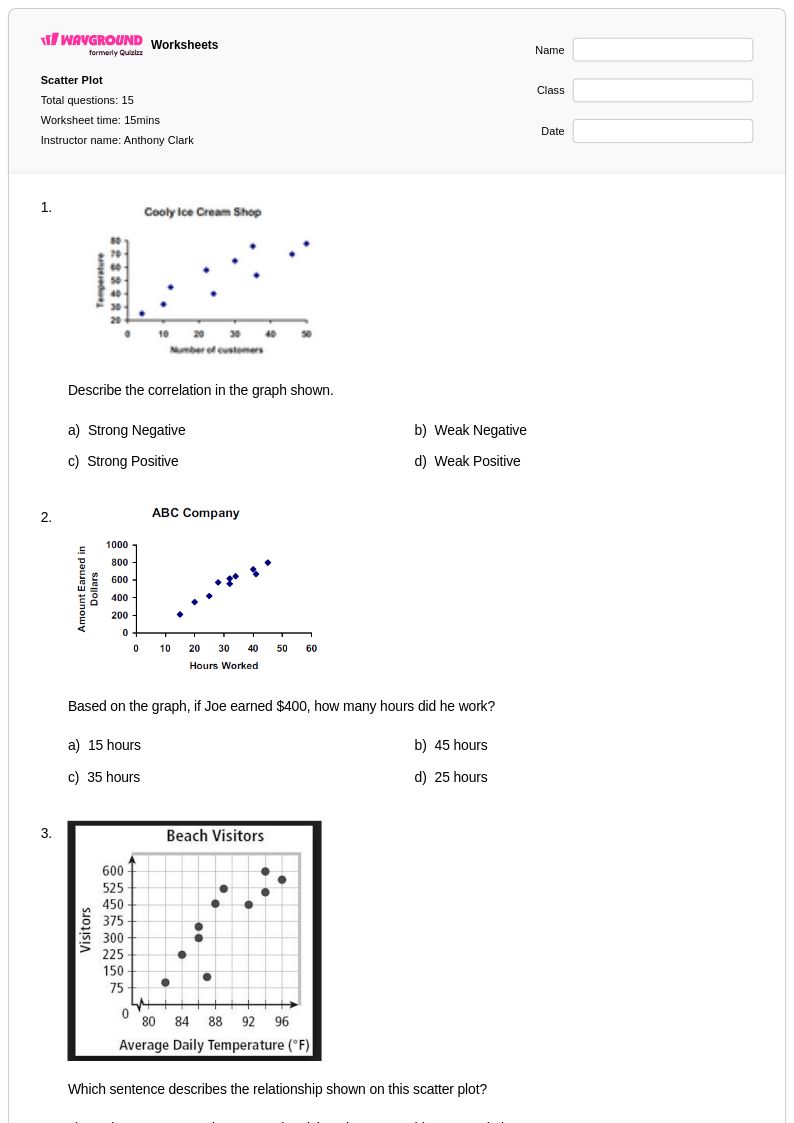
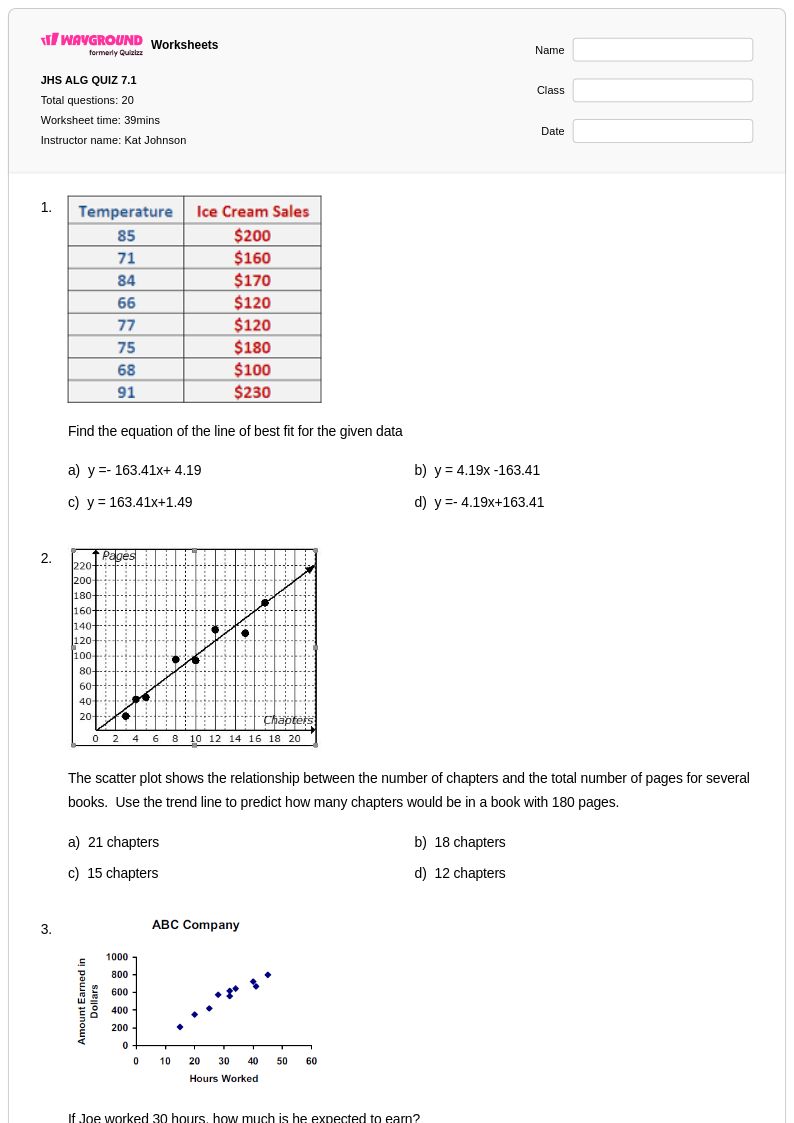
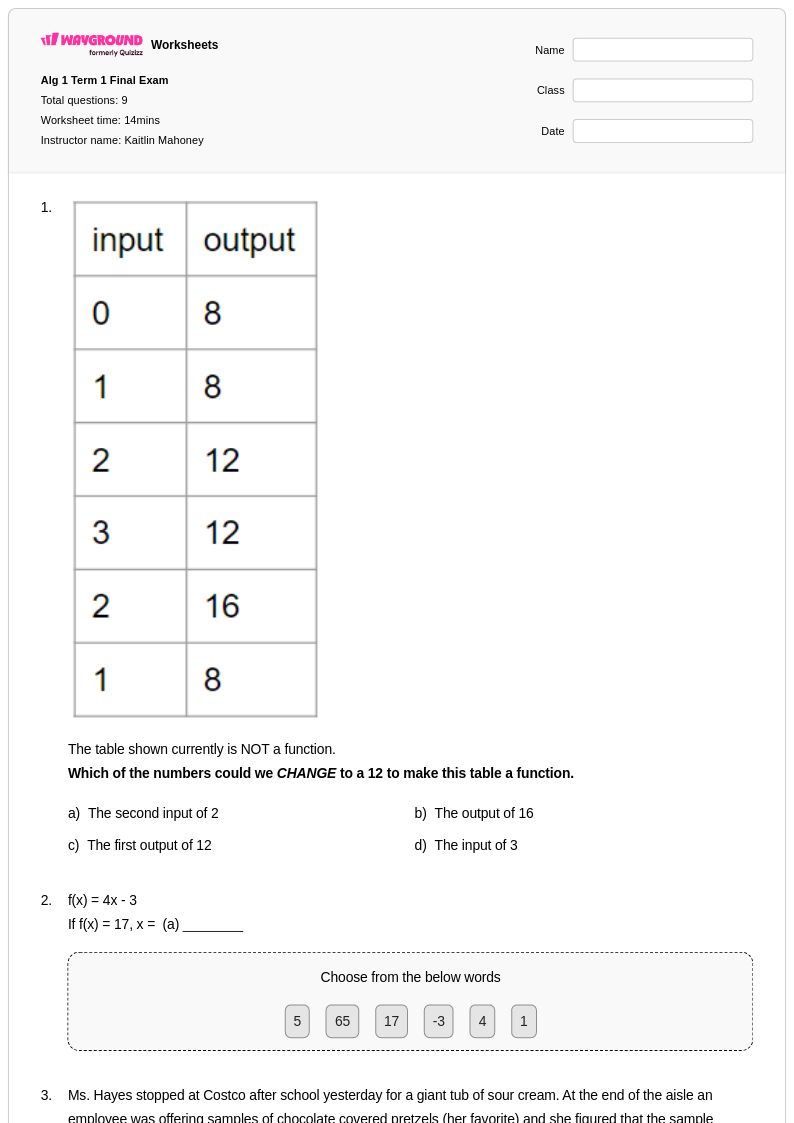
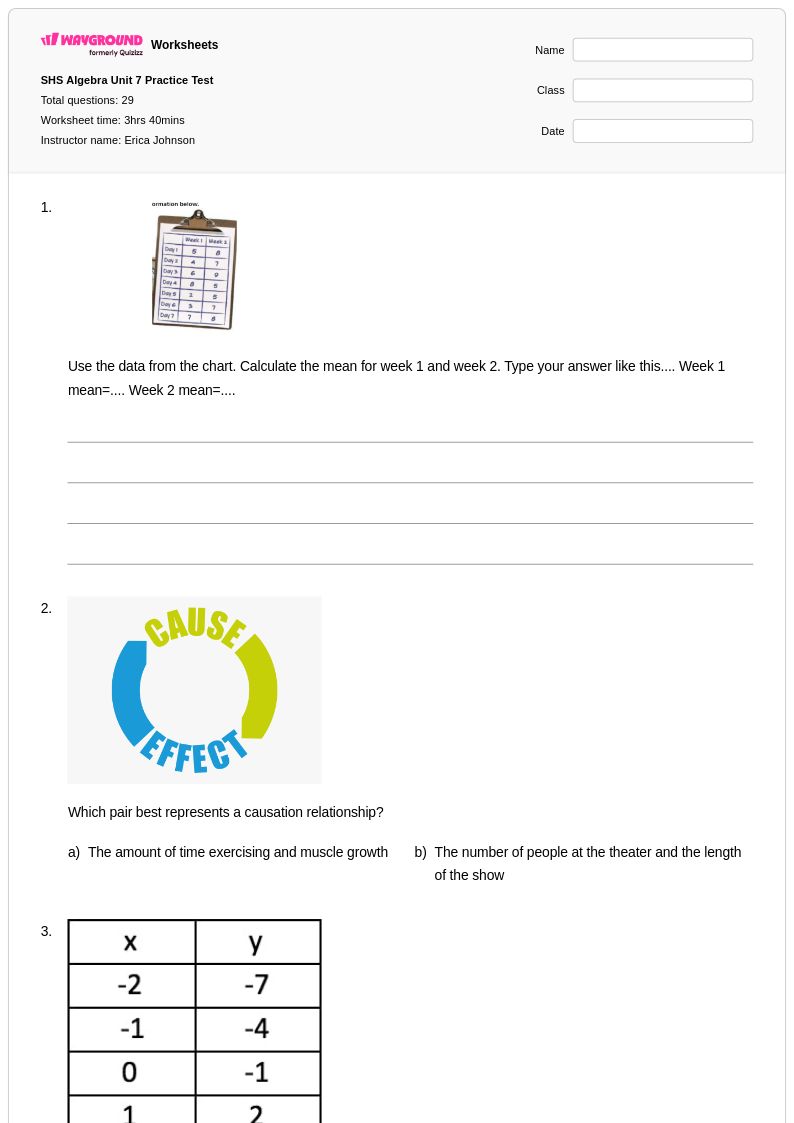
Scatter plot correlation worksheets for Grade 11 mathematics provide students with essential practice in analyzing relationships between variables and interpreting statistical data patterns. These comprehensive resources available through Wayground (formerly Quizizz) focus on developing critical skills including identifying positive, negative, and no correlation patterns, calculating correlation coefficients, distinguishing between correlation and causation, and making predictions based on trend lines. Students work through carefully structured practice problems that progress from basic scatter plot interpretation to advanced statistical analysis, with each worksheet featuring detailed answer keys and explanations to support independent learning. These free printable resources serve as valuable tools for reinforcing classroom instruction and preparing students for standardized assessments that require strong data analysis capabilities.
Wayground (formerly Quizizz) empowers educators with access to millions of teacher-created scatter plot correlation worksheets specifically designed for Grade 11 mathematics instruction. The platform's robust search and filtering system allows teachers to quickly locate resources that align with curriculum standards and match their students' specific learning needs, whether for initial concept introduction, skill reinforcement, or advanced enrichment activities. Teachers can customize these materials to create differentiated learning experiences, adapting difficulty levels and problem types to accommodate diverse classroom populations. Available in both printable PDF format and interactive digital versions, these worksheet collections streamline lesson planning while providing flexible options for in-class practice, homework assignments, and targeted remediation sessions that help students master the complex relationship between statistical correlation and real-world data interpretation.