Free Printable Empirical Rule Worksheets for Class 7
Class 7 Empirical Rule worksheets from Wayground provide free printables and practice problems with answer keys to help students master the 68-95-99.7 rule in probability and statistics.
Explore printable Empirical Rule worksheets for Class 7
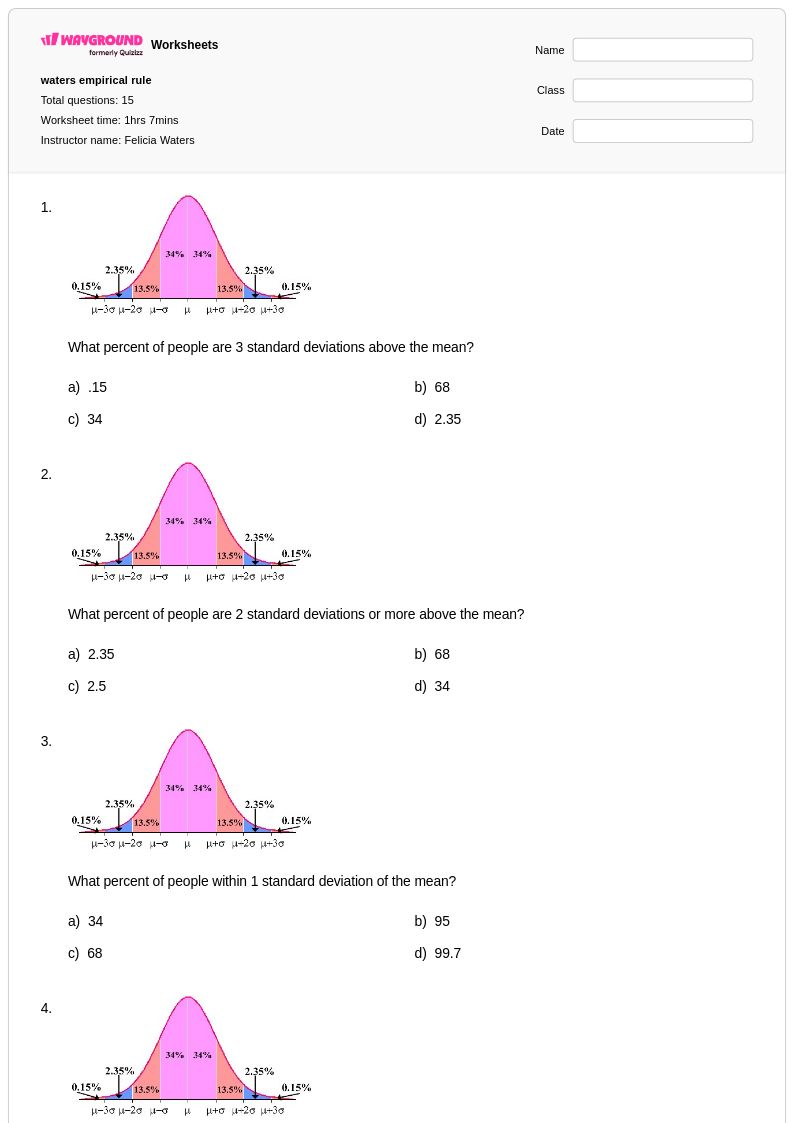
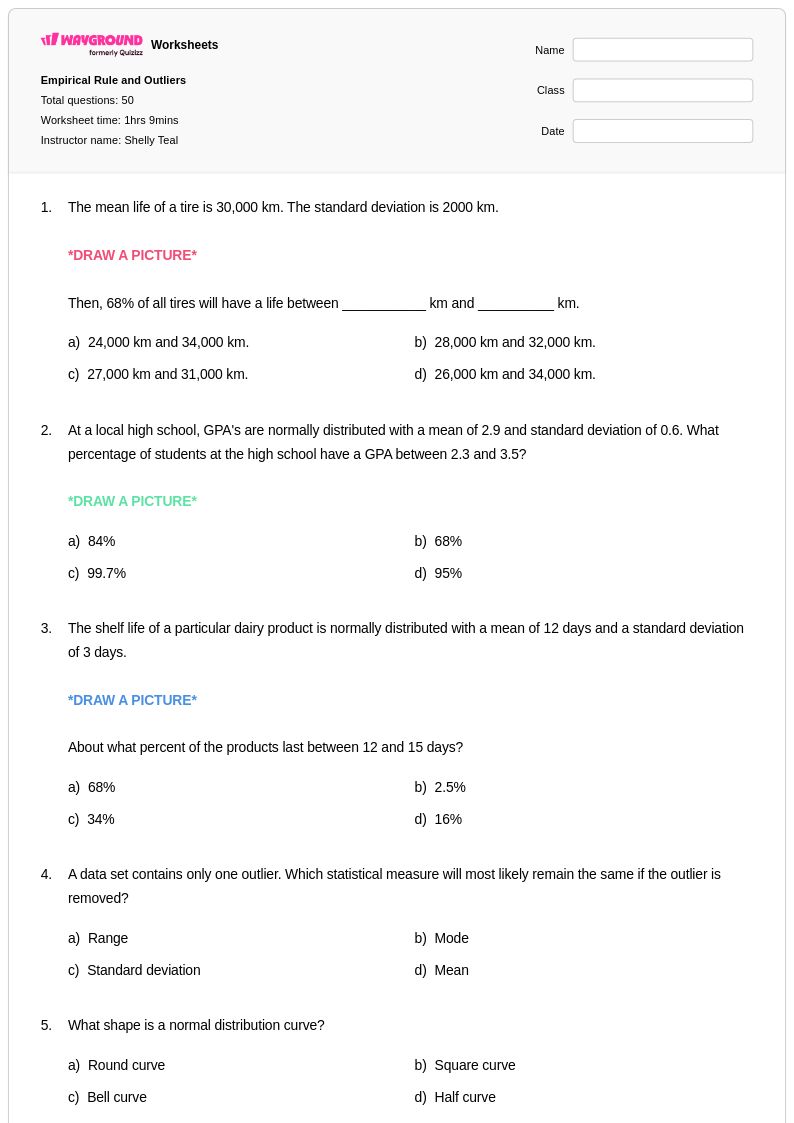
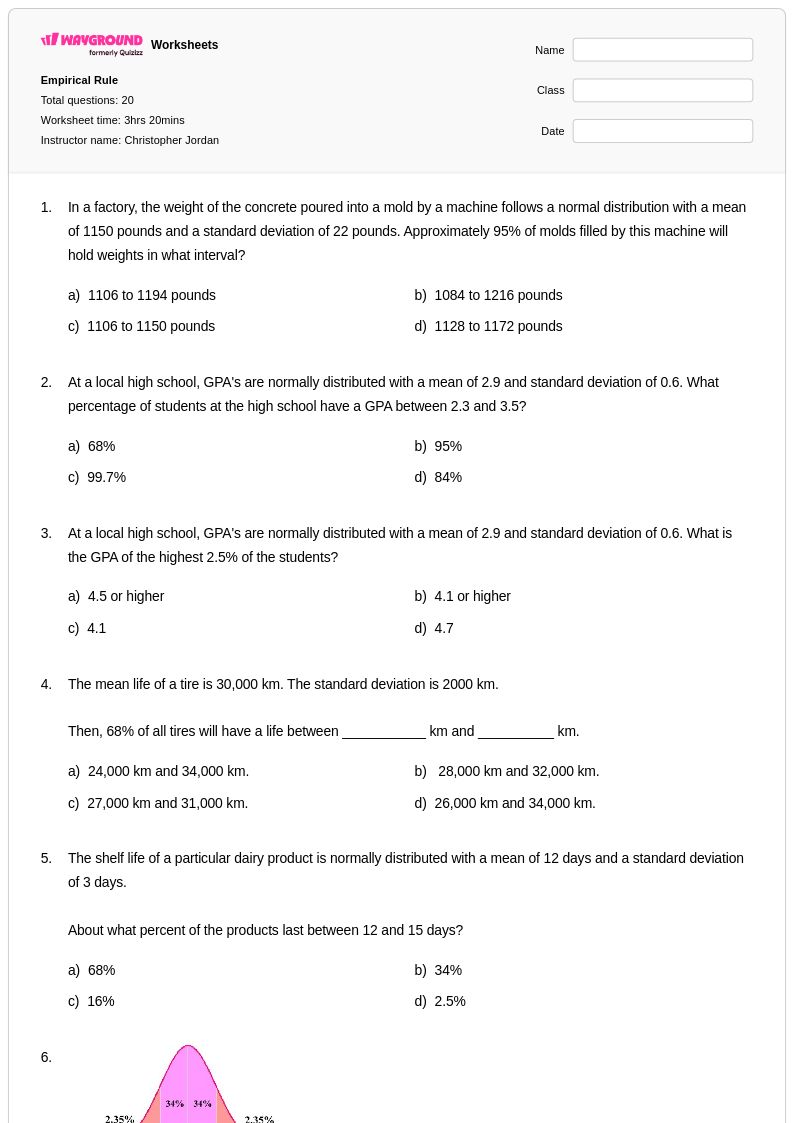
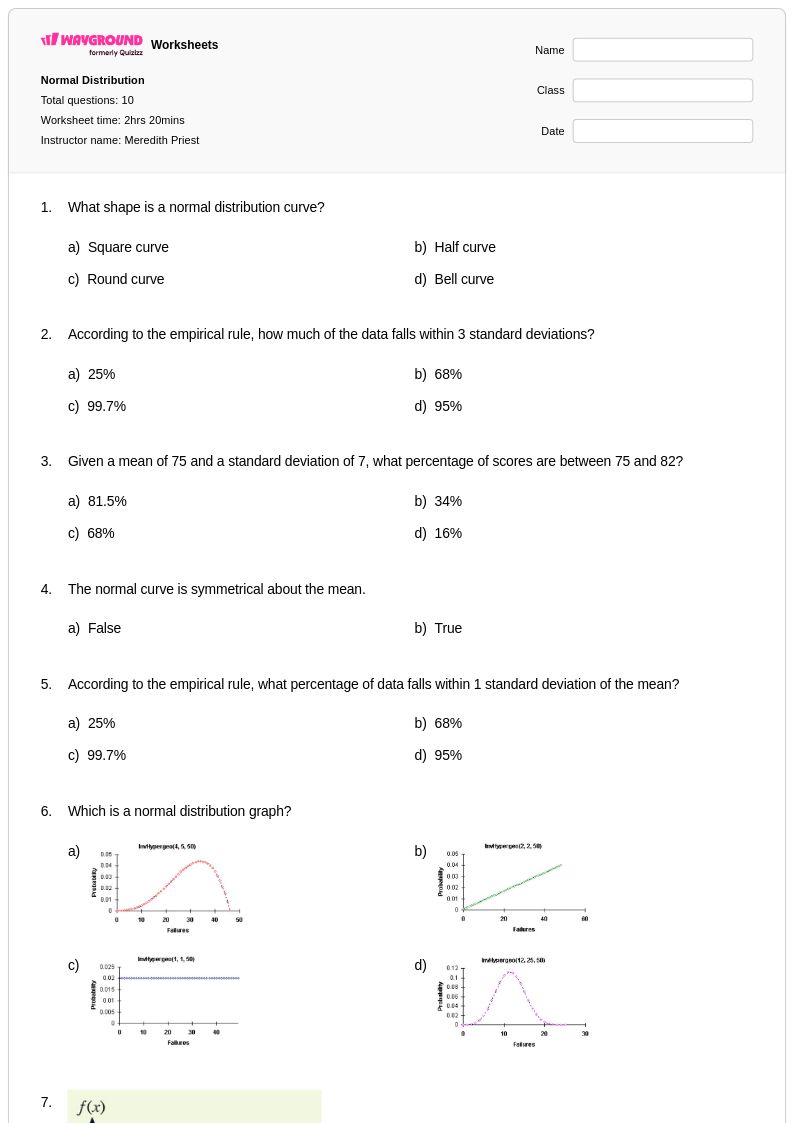
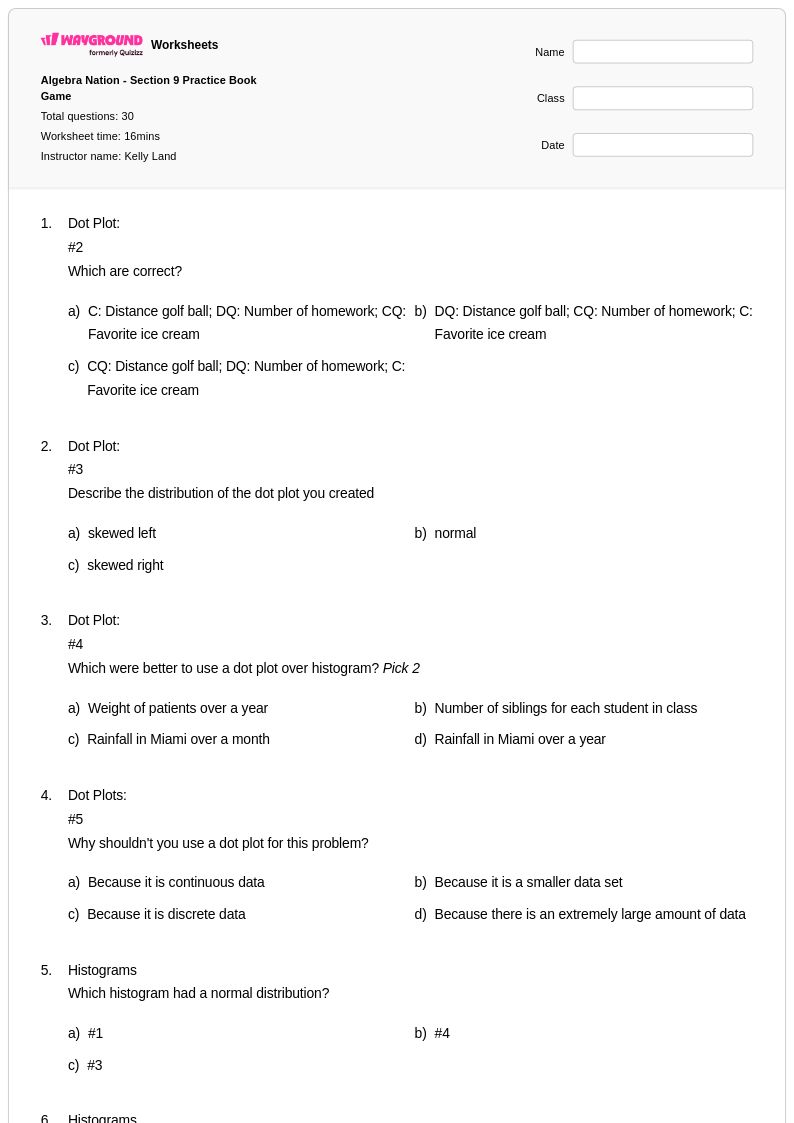
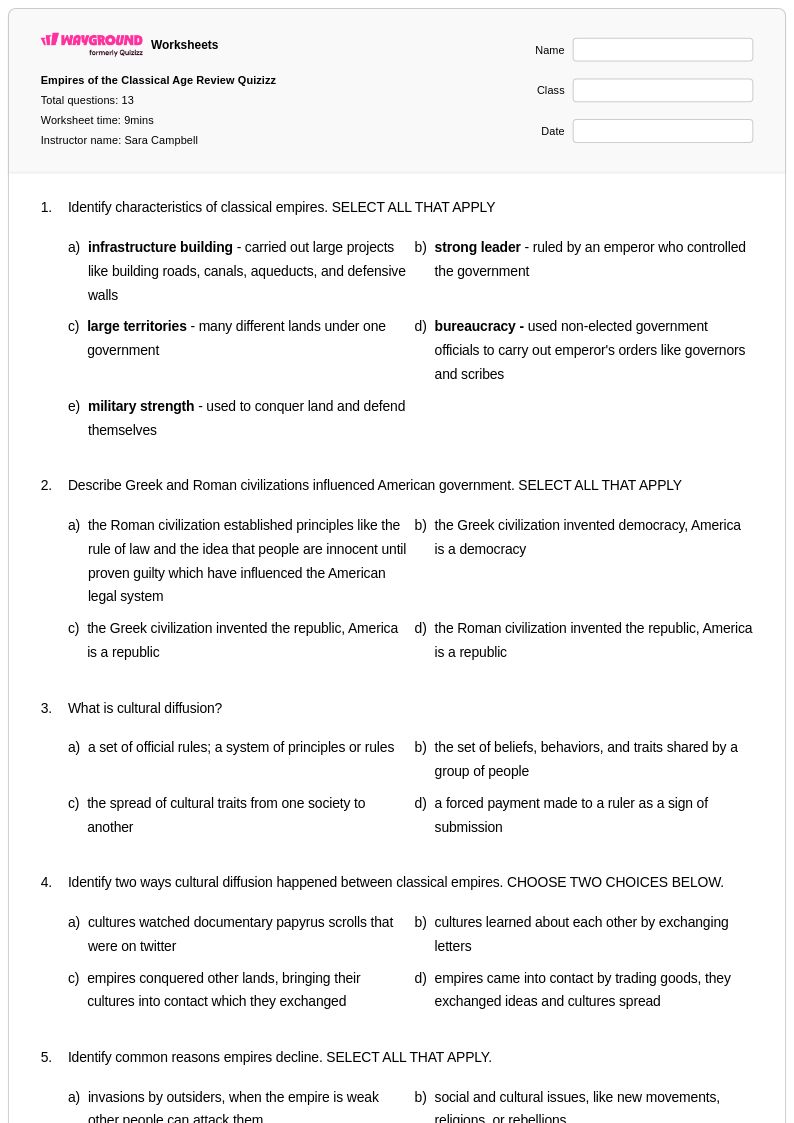
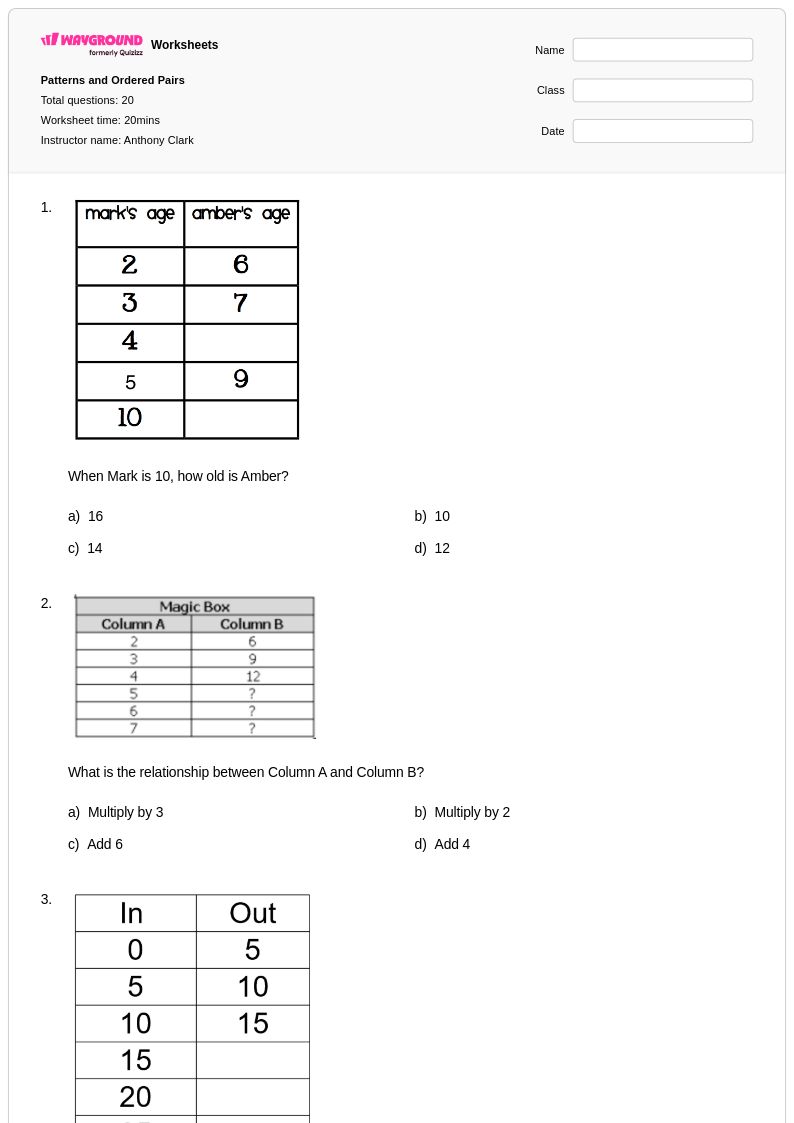
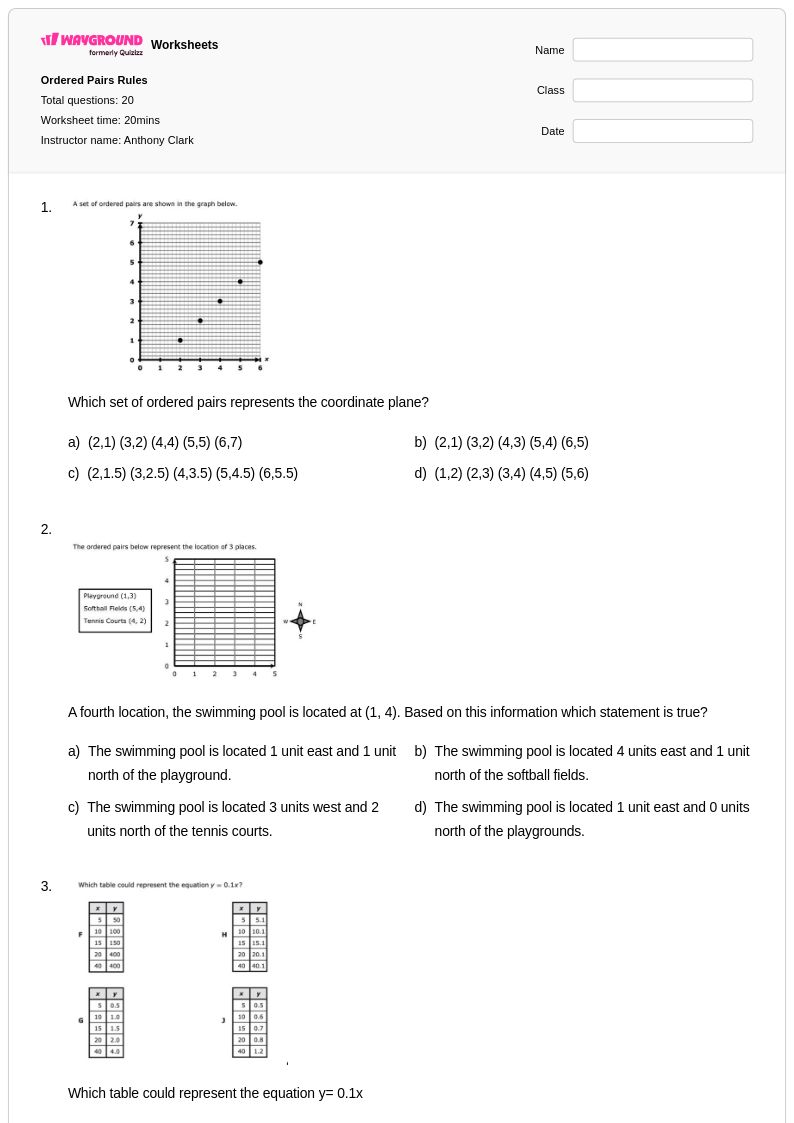
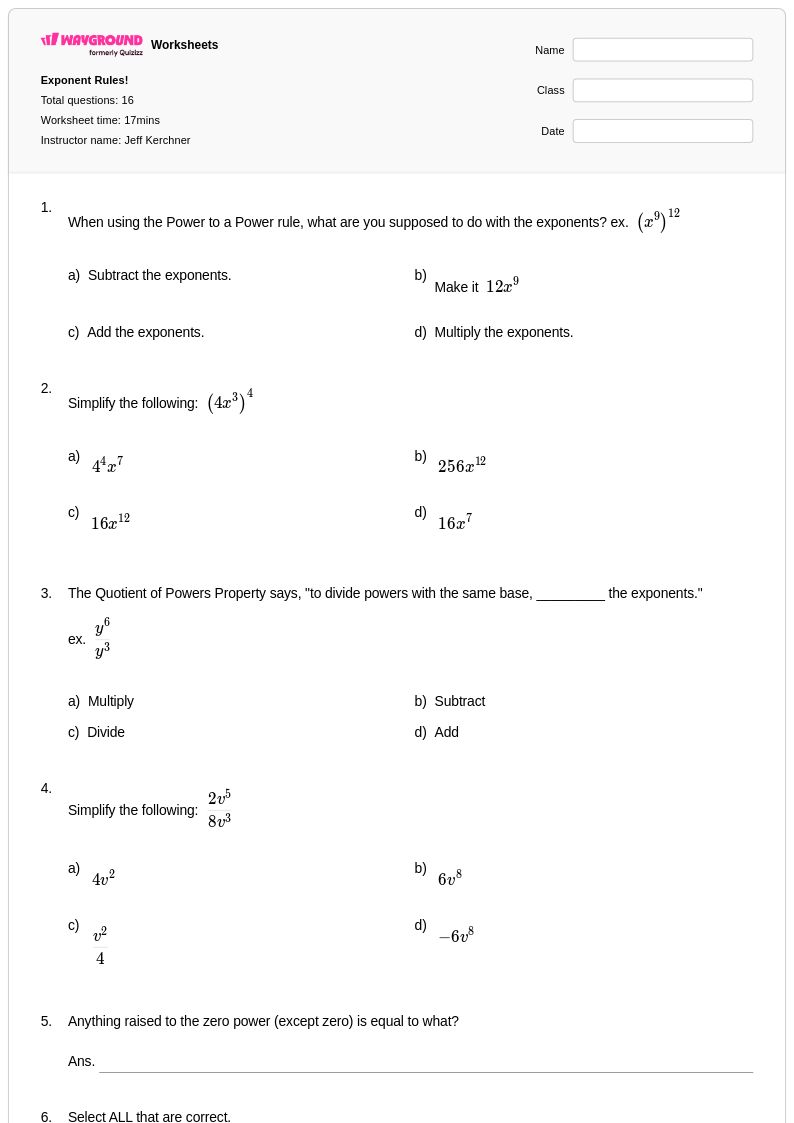
Class 7 Empirical Rule worksheets available through Wayground (formerly Quizizz) provide students with essential practice in understanding how data distributes within one, two, and three standard deviations of the mean in normal distributions. These comprehensive worksheets strengthen critical statistical reasoning skills by guiding students through the fundamental concept that approximately 68% of data falls within one standard deviation, 95% within two standard deviations, and 99.7% within three standard deviations of the mean. Students work with practice problems that involve interpreting real-world scenarios, calculating percentages of data within specific ranges, and applying the 68-95-99.7 rule to various contexts. Each worksheet comes with a detailed answer key to support independent learning and self-assessment, while the free printables in pdf format make it convenient for both classroom instruction and homework assignments.
Wayground (formerly Quizizz) supports mathematics educators with an extensive collection of teacher-created Empirical Rule resources, drawing from millions of high-quality worksheets that align with Class 7 probability and statistics standards. The platform's robust search and filtering capabilities allow teachers to quickly locate materials that match their specific instructional needs, whether focusing on introductory normal distribution concepts or more advanced applications of the Empirical Rule. Differentiation tools enable educators to customize worksheets for varying skill levels within their classrooms, supporting both remediation for struggling learners and enrichment for advanced students. Available in both printable pdf format and digital versions, these flexible resources streamline lesson planning while providing targeted skill practice that helps students master this foundational statistical concept through systematic, scaffolded problem-solving experiences.
FAQs
How do I teach the empirical rule to 7th graders?
By grade 7, students have enough number sense to work with percentages and ranges, so you can move beyond pure visualization into structured calculation. A good sequence: start with a labeled bell curve and have students identify the mean and standard deviation intervals, then give them a mean and standard deviation and ask them to calculate the actual data ranges, then introduce a real-world scenario — like heights of students in a school — and ask what percentage falls within each interval. Grounding each step in a context students recognize keeps the rule from feeling abstract.
What practice problems are most effective for 7th graders working on the empirical rule?
Problems that require students to work in both directions are the most valuable: given a bell curve, determine what percentage falls in a range; and given a percentage, identify the corresponding interval. Wayground's grade 7 worksheets include real-world scenarios — test scores, physical measurements, population data — that give students practice applying the 68-95-99.7 rule to contexts they'll encounter again in later statistics work.
What errors do 7th graders commonly make when applying the empirical rule?
Three errors show up most often: confusing the percentage within an interval with the percentage in a single tail (saying 34% is above the mean rather than between the mean and one standard deviation above it), forgetting that the rule applies only to normal distributions and trying to apply it to skewed data, and arithmetic errors when calculating the actual data values at each standard deviation boundary. Quick diagnostic: ask students to draw and label the bell curve from memory before solving any problem — gaps in the diagram usually predict which error they'll make.
How do I use Wayground's grade 7 empirical rule worksheets?
You can assign these as a digital quiz on Wayground, where students work through problems online and you see results in real time, or print the PDF for paper-based practice. Every worksheet comes with a complete answer key. If you print and collect submissions, the Wayground for Teachers app lets you scan student work for grading rather than scoring each page by hand.
Is the empirical rule aligned to 7th grade Common Core math standards?
Common Core places the empirical rule formally in the high school statistics strand, but grade 7 is where students build the statistical reasoning it depends on — specifically, using measures of center and variability to describe and compare distributions. A 7th grader who understands mean absolute deviation and can describe a distribution's spread is well-positioned to make sense of standard deviation and the 68-95-99.7 rule when they encounter them. Introducing the empirical rule at grade 7 works best as an extension of that variability work rather than as a standalone topic.
How can I differentiate empirical rule practice for my 7th grade class?
For students who need more support, Wayground's reduced answer choices accommodation narrows the options displayed on digital questions — useful when students understand the concept but get overwhelmed choosing among four similar-looking percentages. For students ready for a challenge, look for problems that ask them to work backwards: given that 95% of a dataset falls between 140 and 200, determine the mean and standard deviation. That reversal requires genuine understanding of the rule rather than pattern-matching.