Free Printable Empirical Rule Worksheets for Class 6
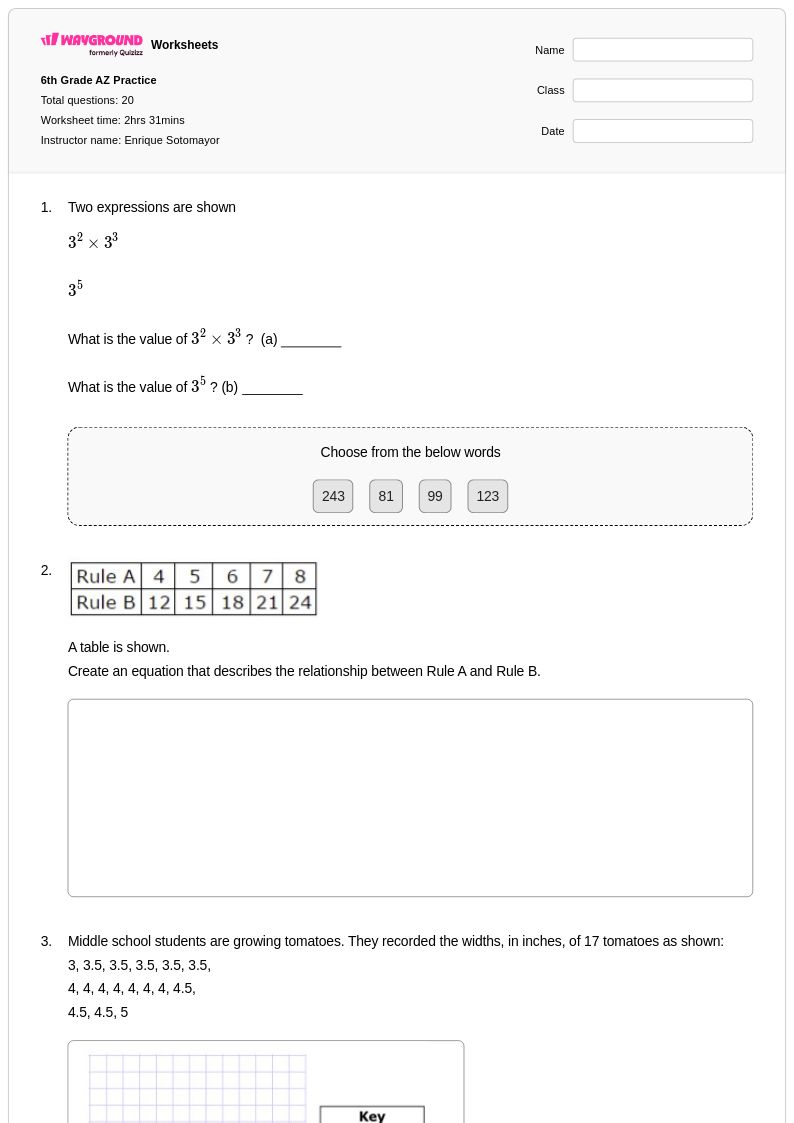
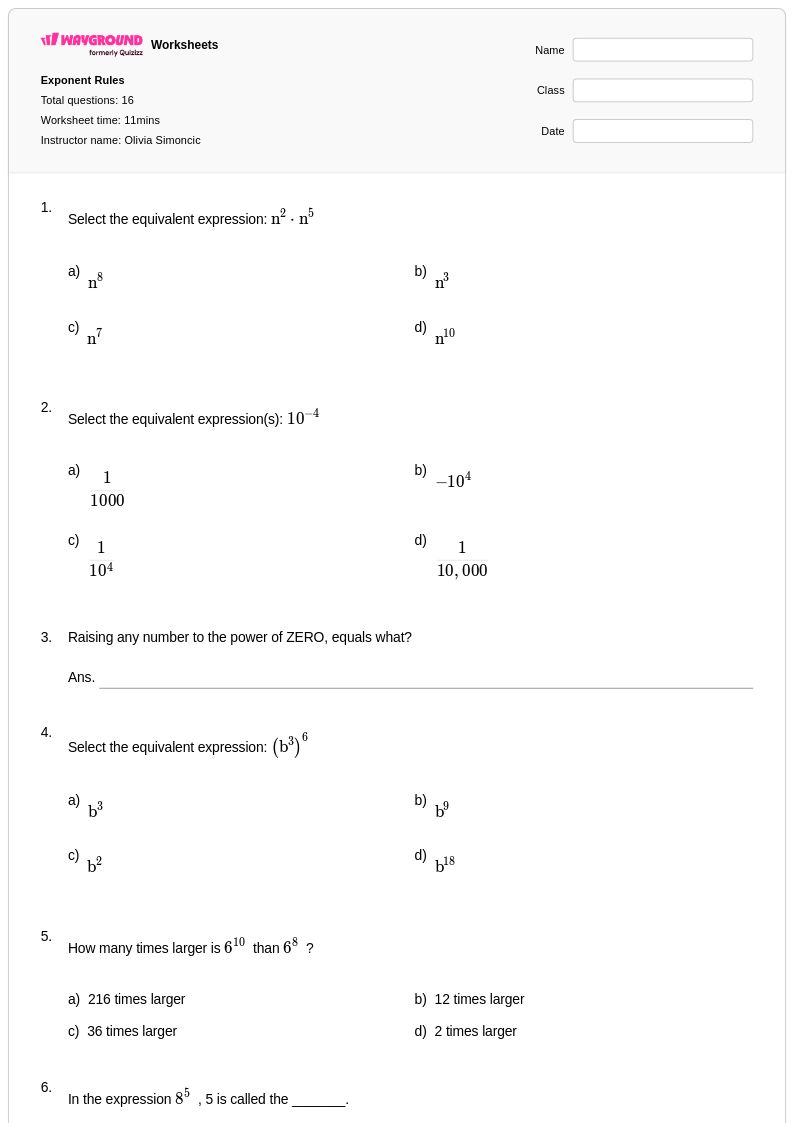
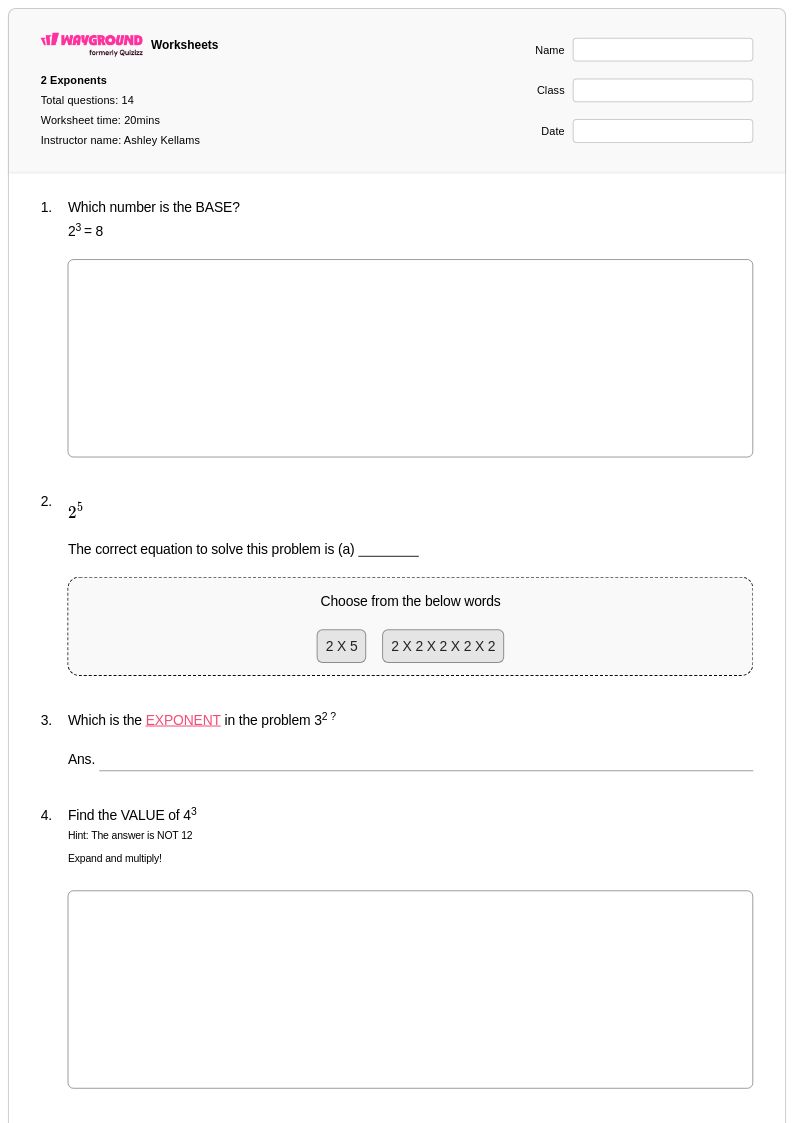
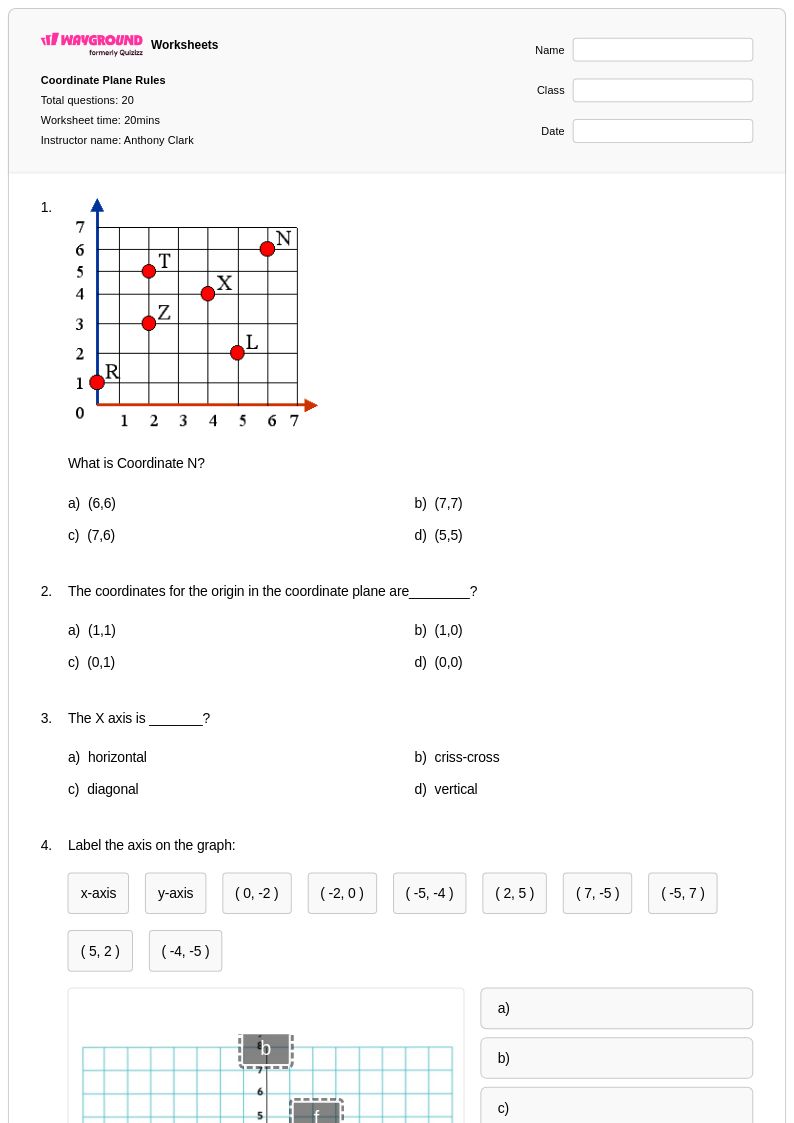
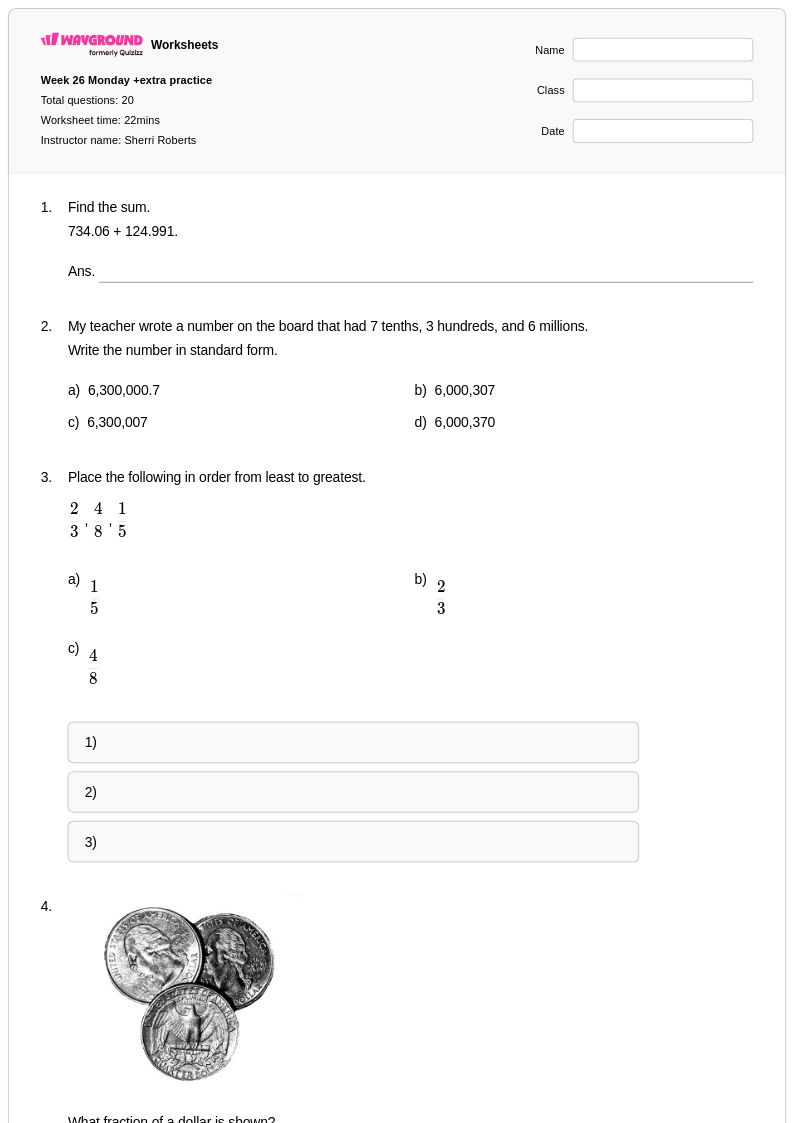
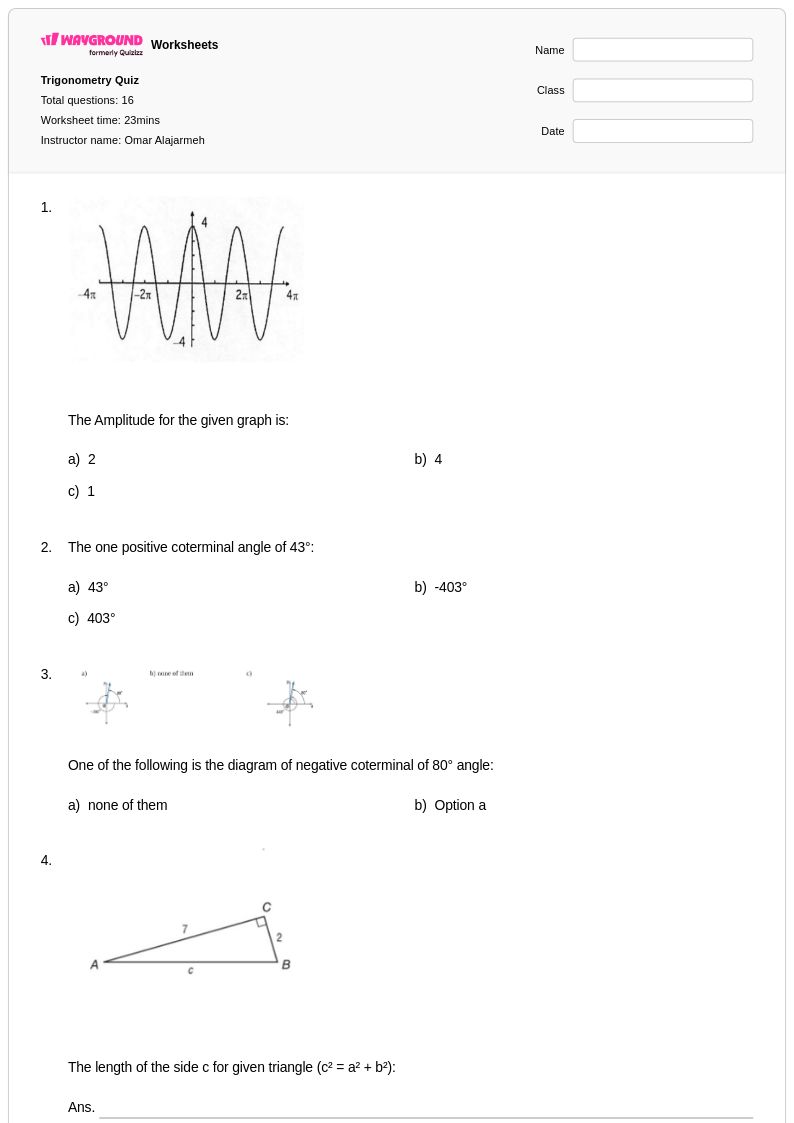
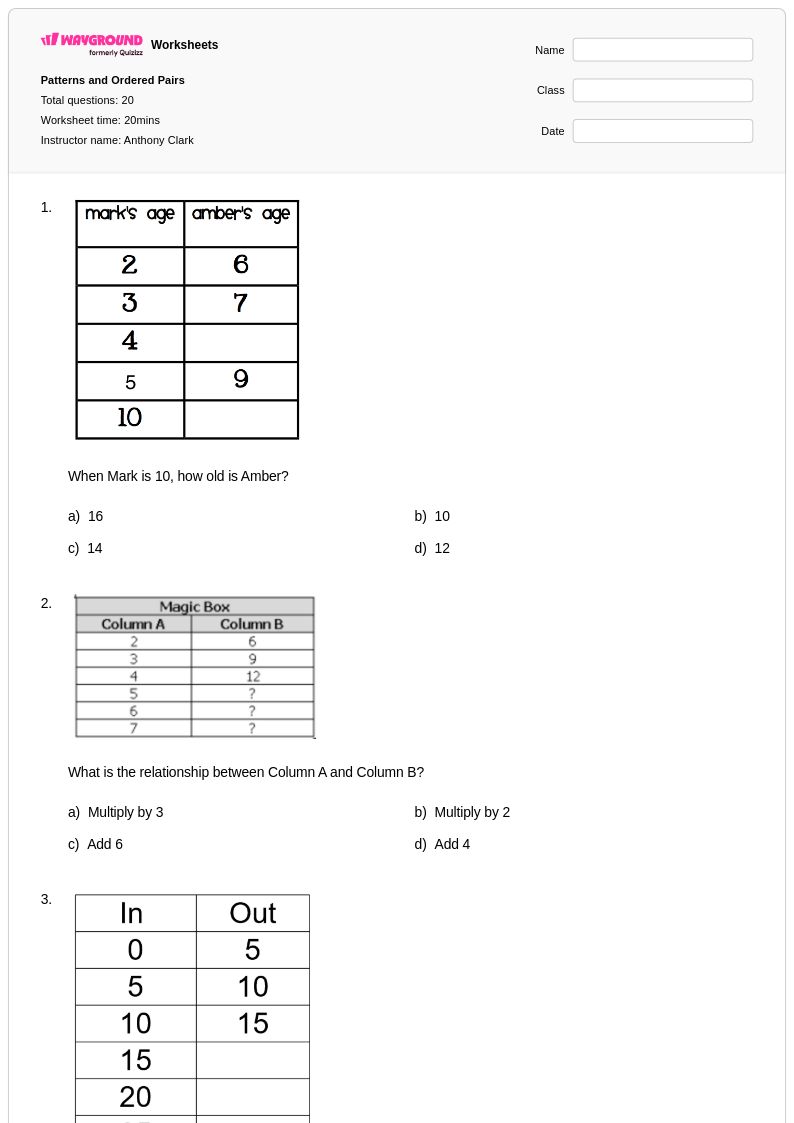
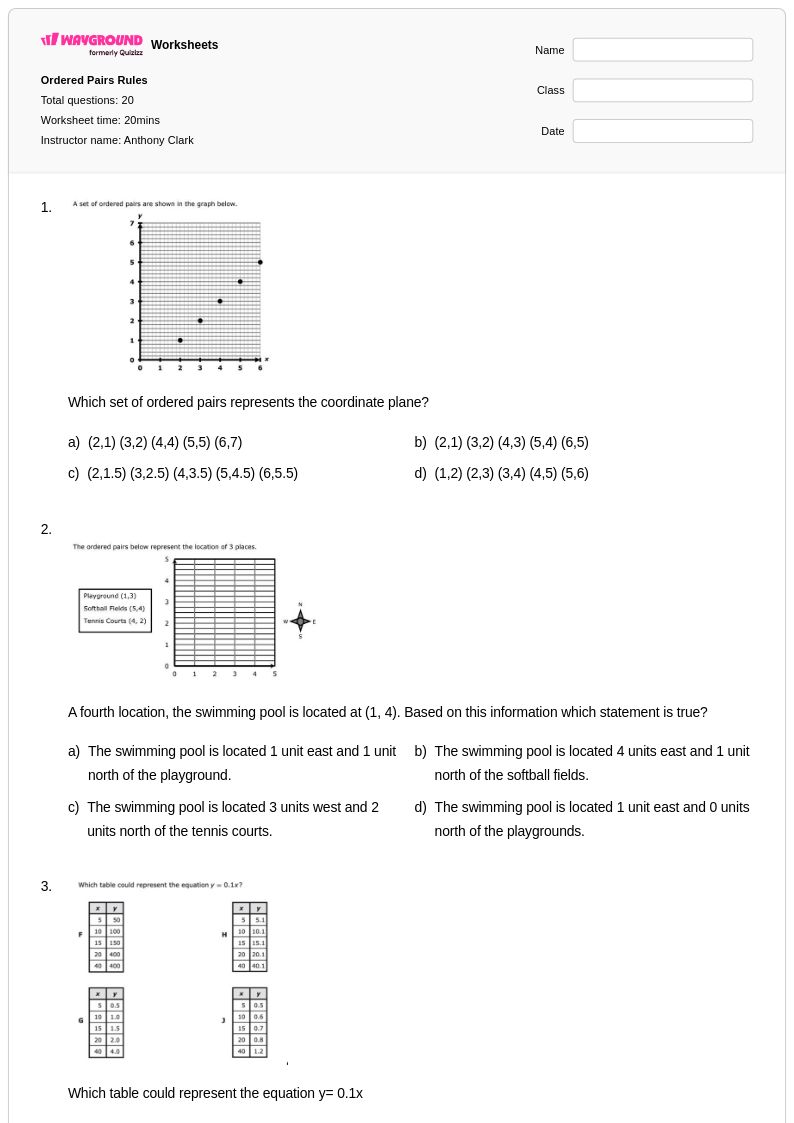
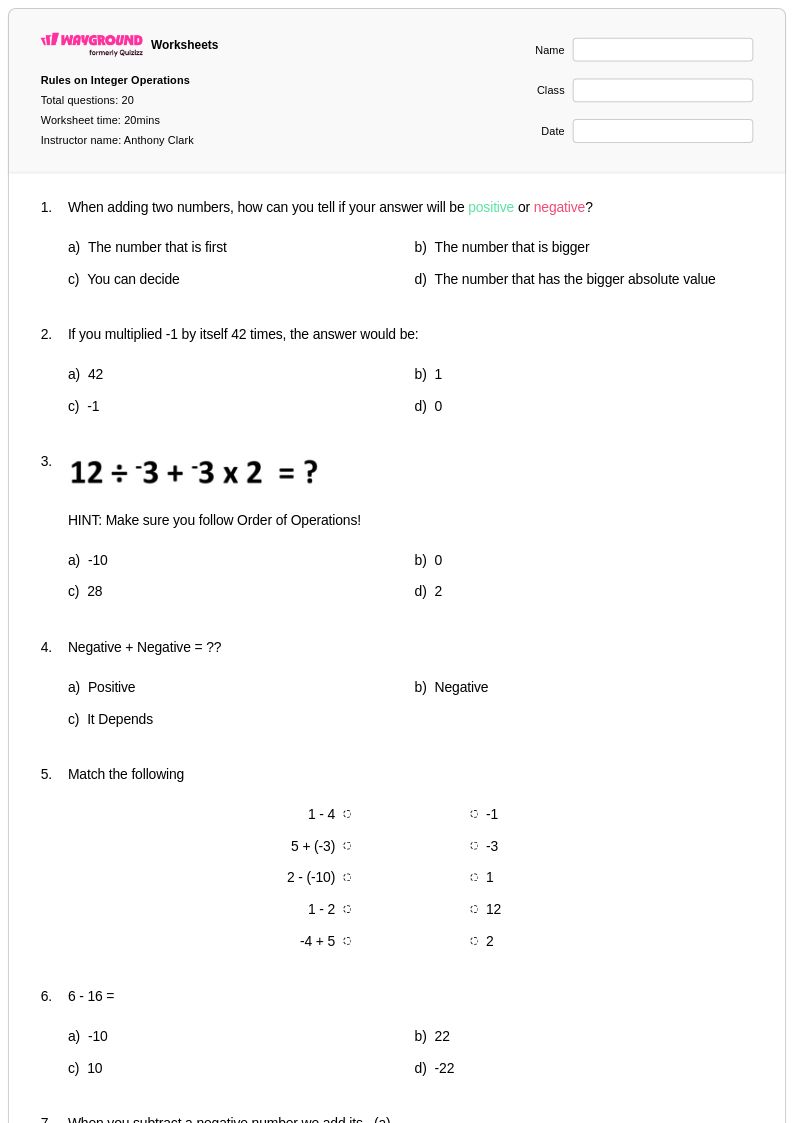
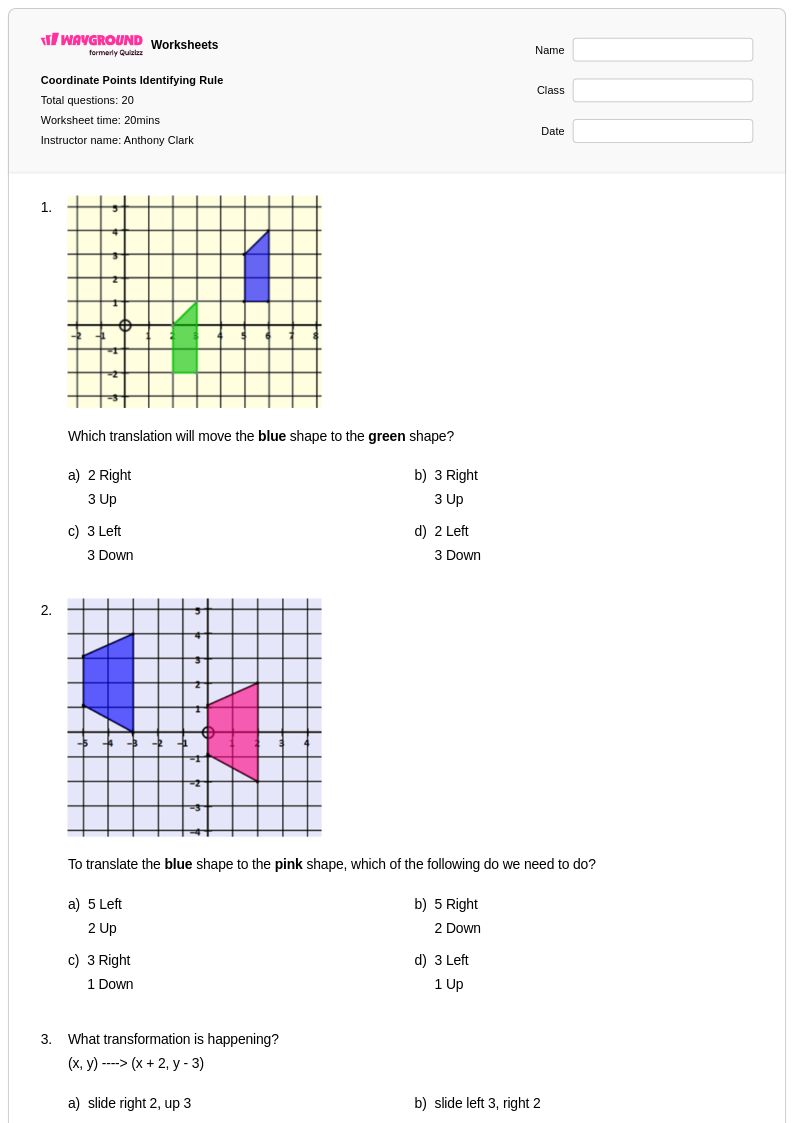
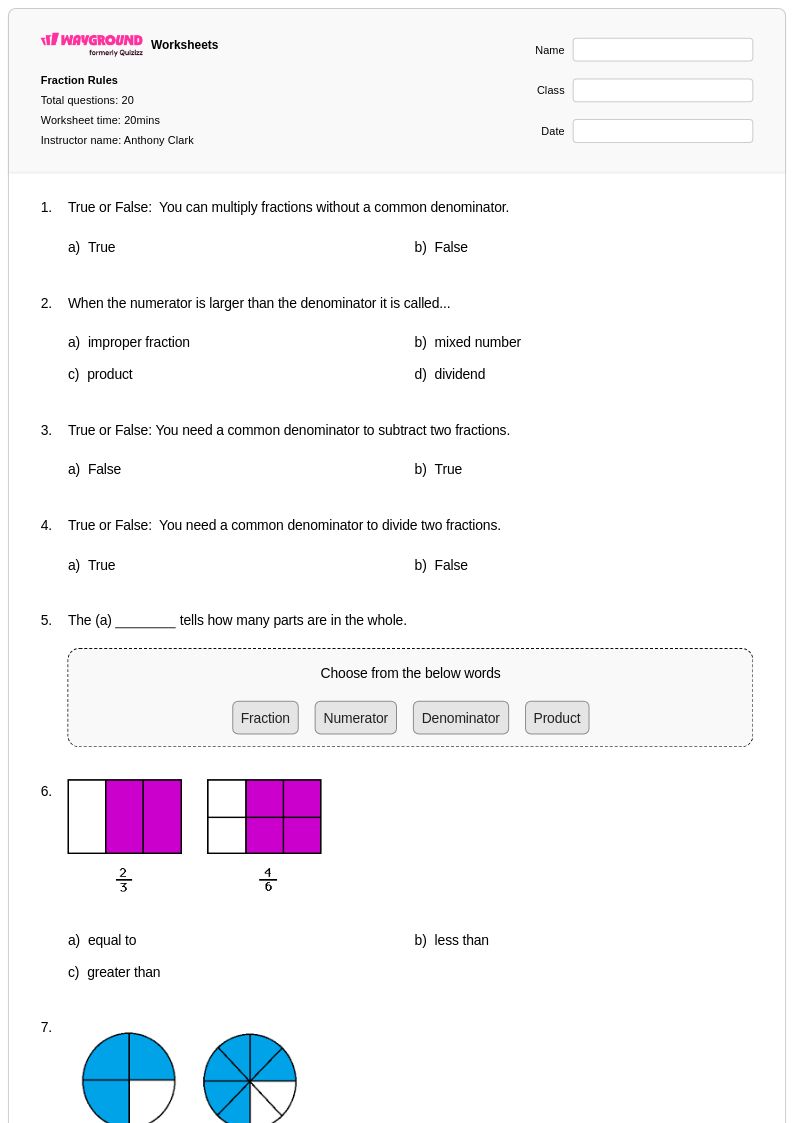
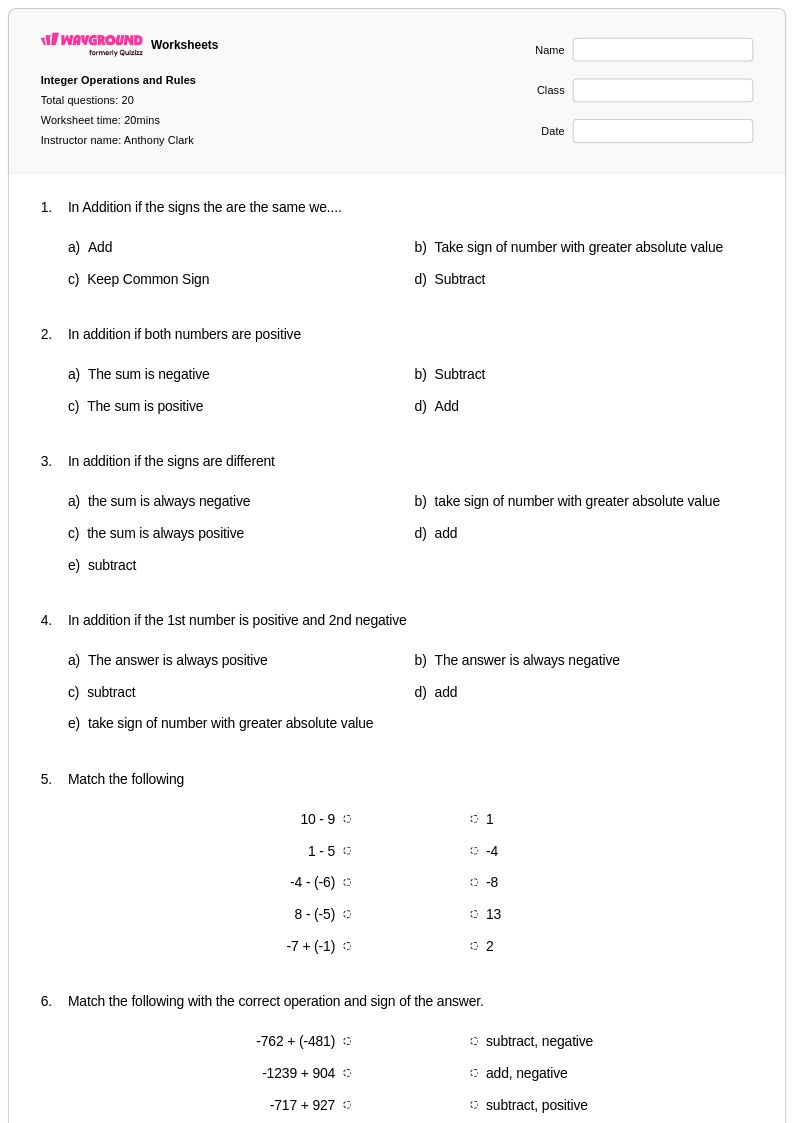
Wayground offers free Class 6 Empirical Rule worksheets and printables with practice problems and answer keys to help students master statistical analysis and normal distribution concepts in mathematics.
Explore printable Empirical Rule worksheets for Class 6
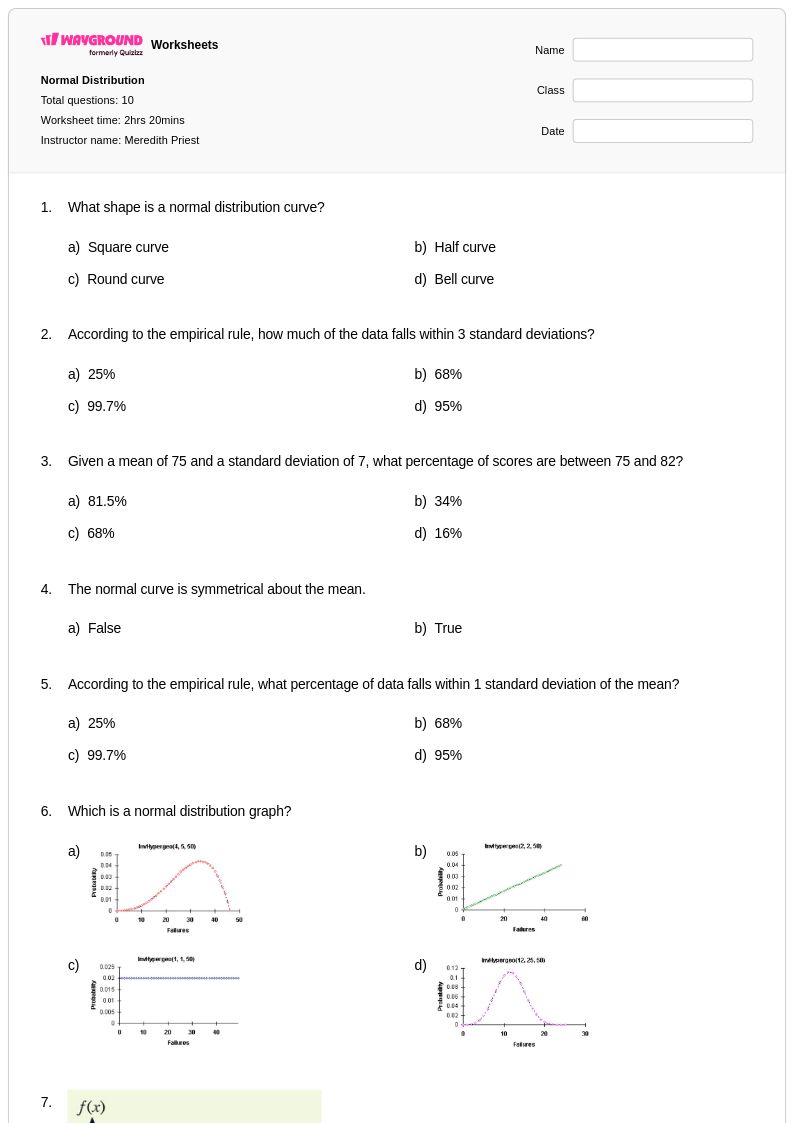
Class 6 Empirical Rule worksheets available through Wayground (formerly Quizizz) provide students with essential practice in understanding how data distributes within one, two, and three standard deviations of the mean in a normal distribution. These carefully designed worksheets strengthen foundational statistical reasoning skills by guiding students through the concept that approximately 68% of data falls within one standard deviation, 95% within two standard deviations, and 99.7% within three standard deviations of the mean. Each worksheet includes comprehensive practice problems that help students visualize and apply this fundamental principle of statistics, with complete answer keys provided to support independent learning and self-assessment. The free printable resources offer varied approaches to exploring the Empirical Rule, from interpreting bell curves to solving real-world problems involving normal distributions, ensuring students develop both conceptual understanding and computational fluency.
Wayground (formerly Quizizz) empowers educators with millions of teacher-created Empirical Rule worksheet resources that can be easily discovered through robust search and filtering capabilities, allowing teachers to locate materials perfectly aligned to Class 6 mathematics standards and specific learning objectives. The platform's differentiation tools enable teachers to customize worksheets for diverse learning needs, providing additional scaffolding for struggling students while offering enrichment opportunities for advanced learners ready to explore more complex statistical concepts. These versatile resources are available in both printable pdf format for traditional classroom use and digital formats for technology-integrated instruction, making them invaluable for lesson planning, targeted remediation sessions, and skill-building practice that helps students master this critical foundation for advanced statistical thinking.
FAQs
How do I introduce the empirical rule to 6th graders?
At grade 6, the goal is building intuition, not formula fluency. Start by having students collect a simple class dataset — pencil lengths, step counts, or quiz scores — and plot the values on a number line. Point out that most values cluster in the middle and fewer appear at the edges, then introduce the bell curve as a way to describe that pattern. The 68-95-99.7 percentages become meaningful once students have seen the shape emerge from real data rather than being handed a rule to memorize.
What practice exercises work best for 6th graders learning the empirical rule?
At this level, focus on reading and interpreting rather than calculating from scratch. Good exercises include: labeling a pre-drawn bell curve with the mean and standard deviation intervals, identifying what percentage of data falls within a shaded region, and answering questions like 'If the mean is 50 and the standard deviation is 5, what range contains about 95% of the data?' Wayground's grade 6 empirical rule worksheets include bell curve diagrams and real-world scenarios that keep the problems grounded without requiring advanced algebra.
What misconceptions do 6th graders typically have about the empirical rule?
The most common one is treating the three intervals as separate buckets rather than nested ranges — students will say 95% of data is in the second standard deviation rather than within two standard deviations of the mean. A quick fix: draw the intervals as concentric bands on the bell curve and ask students to shade the entire region, not just the outer ring, when answering a question about two standard deviations.
How do I use these grade 6 empirical rule worksheets in my classroom?
These worksheets are available as printable PDFs — useful for schools managing screen time or working in low-device environments — and as digital assignments hosted on Wayground. Each worksheet includes a full answer key, so students can self-assess after independent practice. For a blended approach, assign the digital version for initial practice where Wayground tracks responses, then use the printable for a follow-up review session.
Is the empirical rule part of the 6th grade Common Core math curriculum?
The empirical rule itself is a high school statistics concept under Common Core, but grade 6 lays the groundwork for it. At grade 6, Common Core focuses on understanding distributions — describing the shape, center, and spread of data sets and recognizing that data clusters around a center with variability. Students who work with normal distributions and bell curves at grade 6 are building the conceptual foundation that makes the 68-95-99.7 rule intuitive when they encounter it formally in high school.
How can I support 6th grade students who struggle with reading bell curve diagrams?
Bell curves are visually dense, and students with reading difficulties or visual processing challenges can lose the statistical meaning in the layout. Wayground's worksheet tools let you increase font size and apply wider line spacing to reduce clutter on diagram-heavy pages. For students who need questions read aloud, the digital version supports a Read Aloud accommodation — helpful when the barrier is decoding the problem text rather than understanding the statistics.