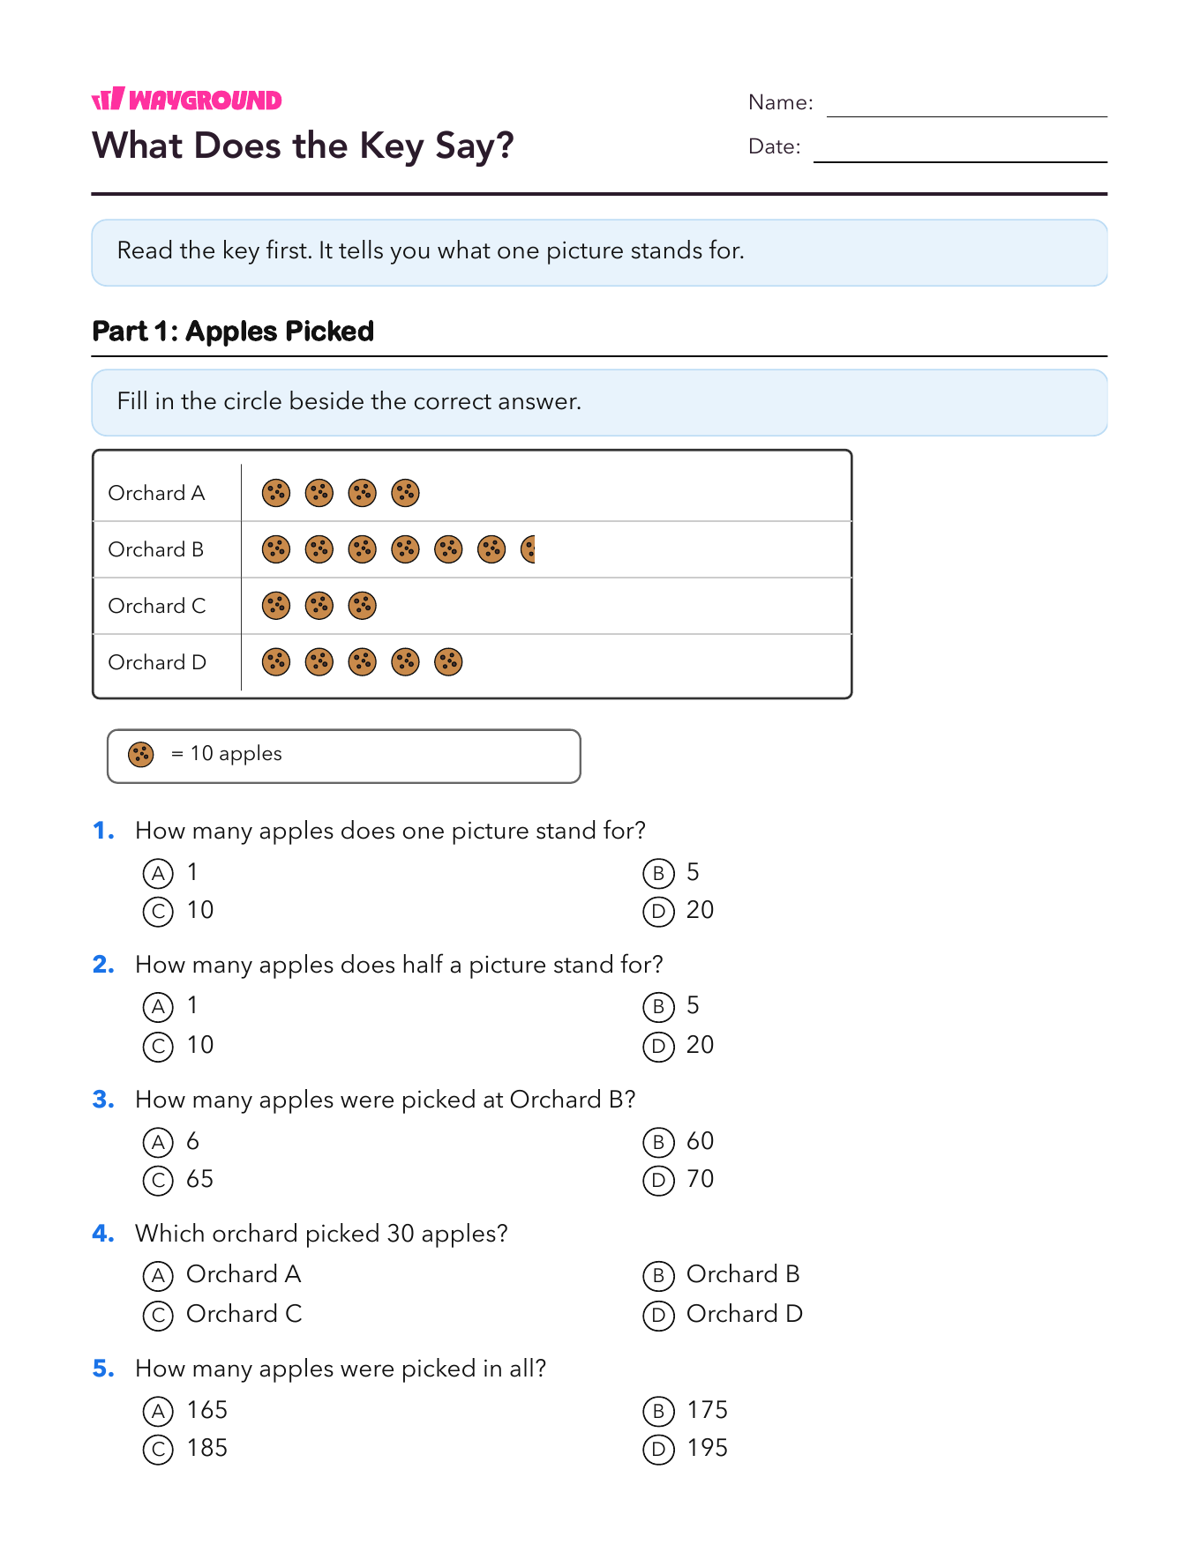
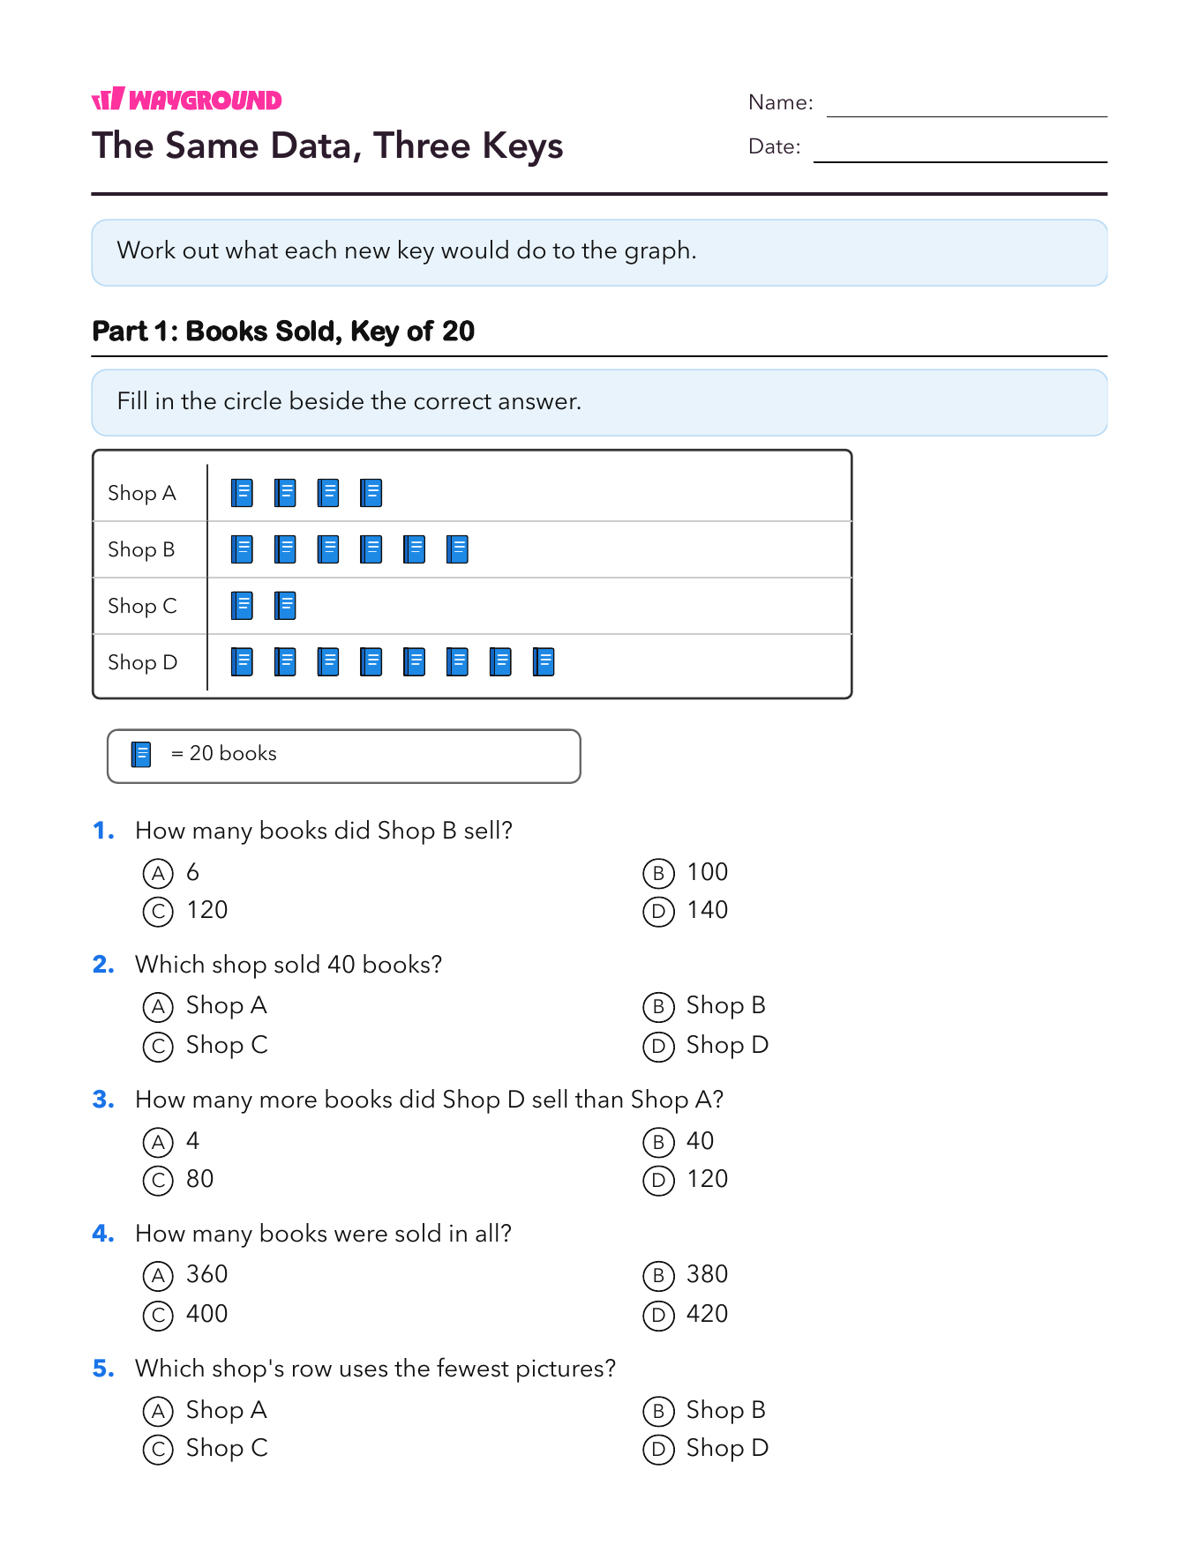
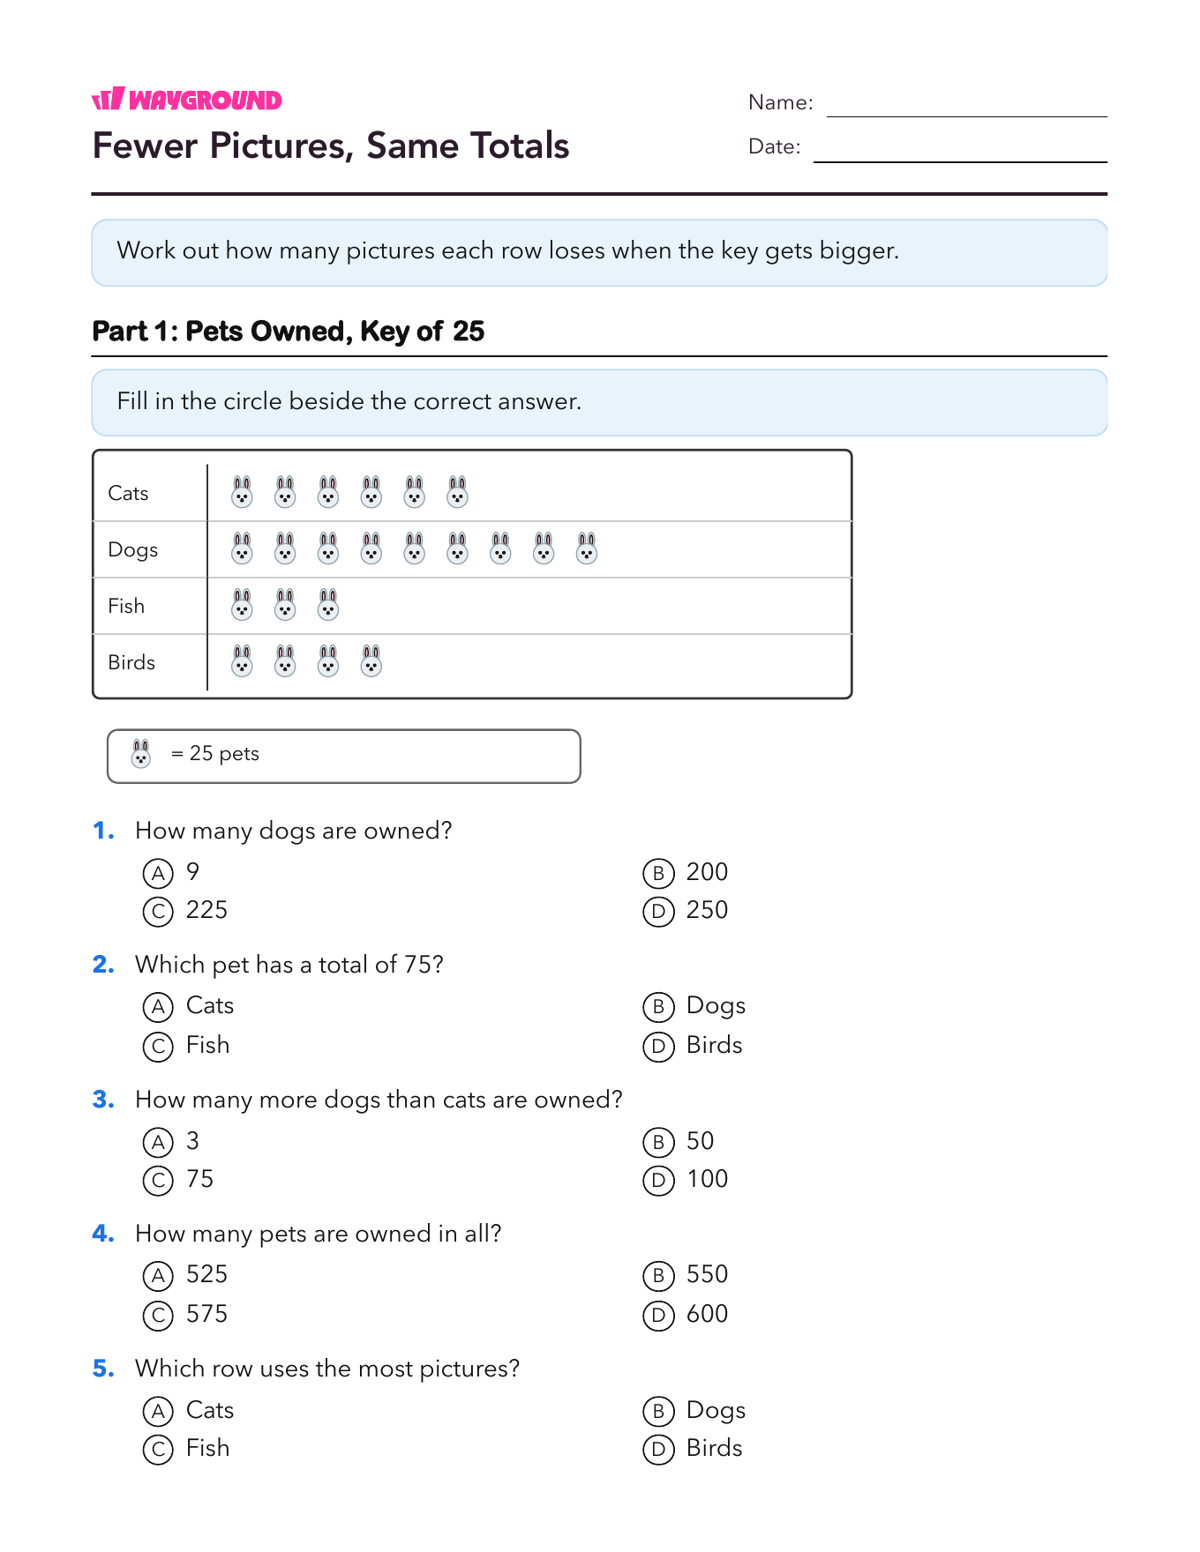
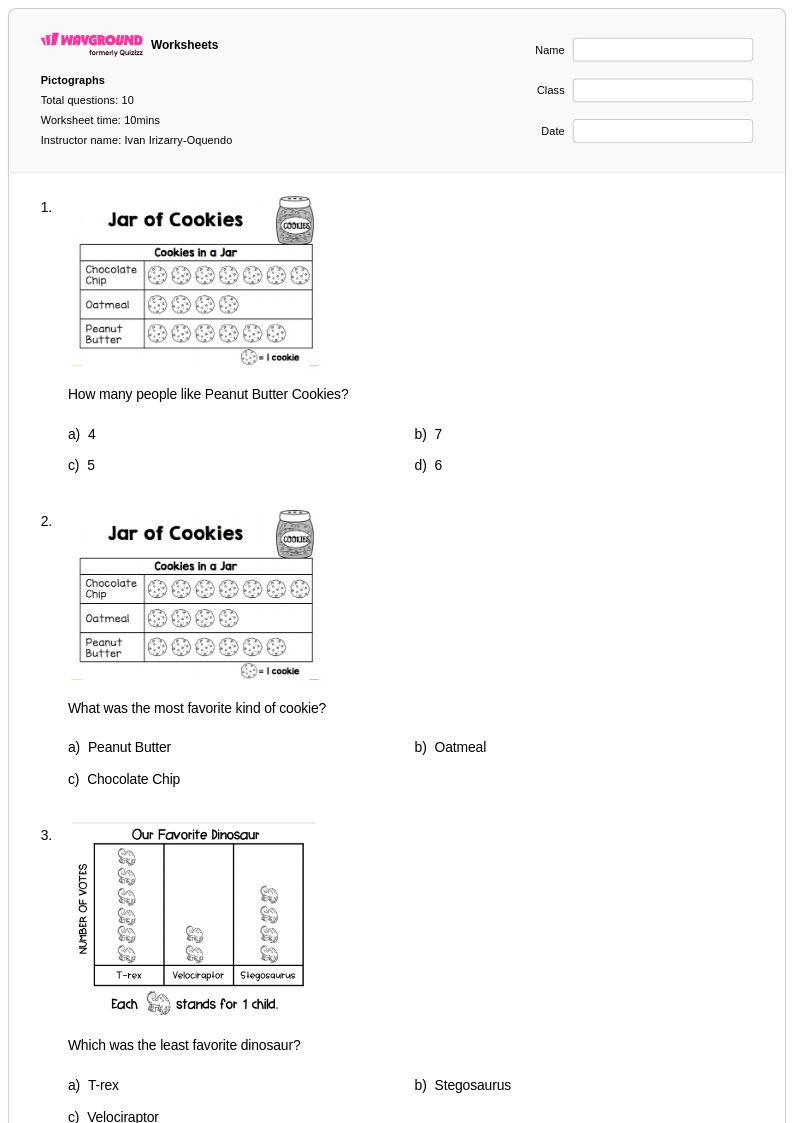
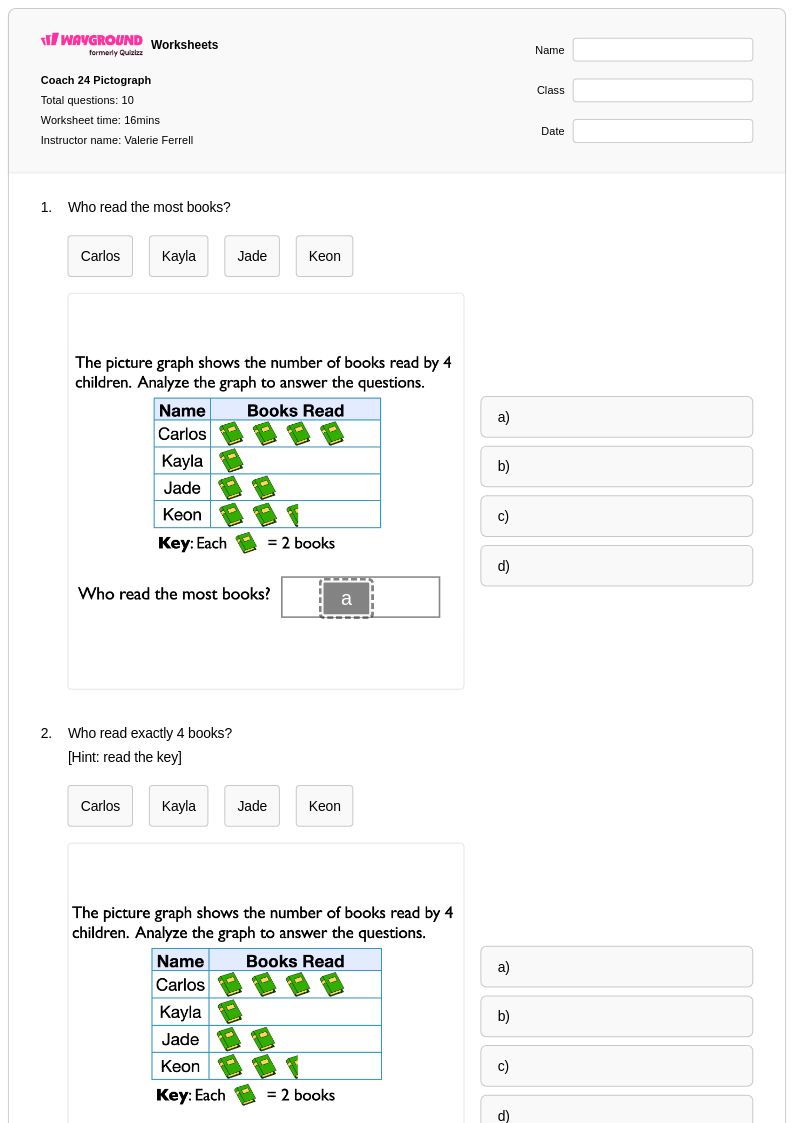
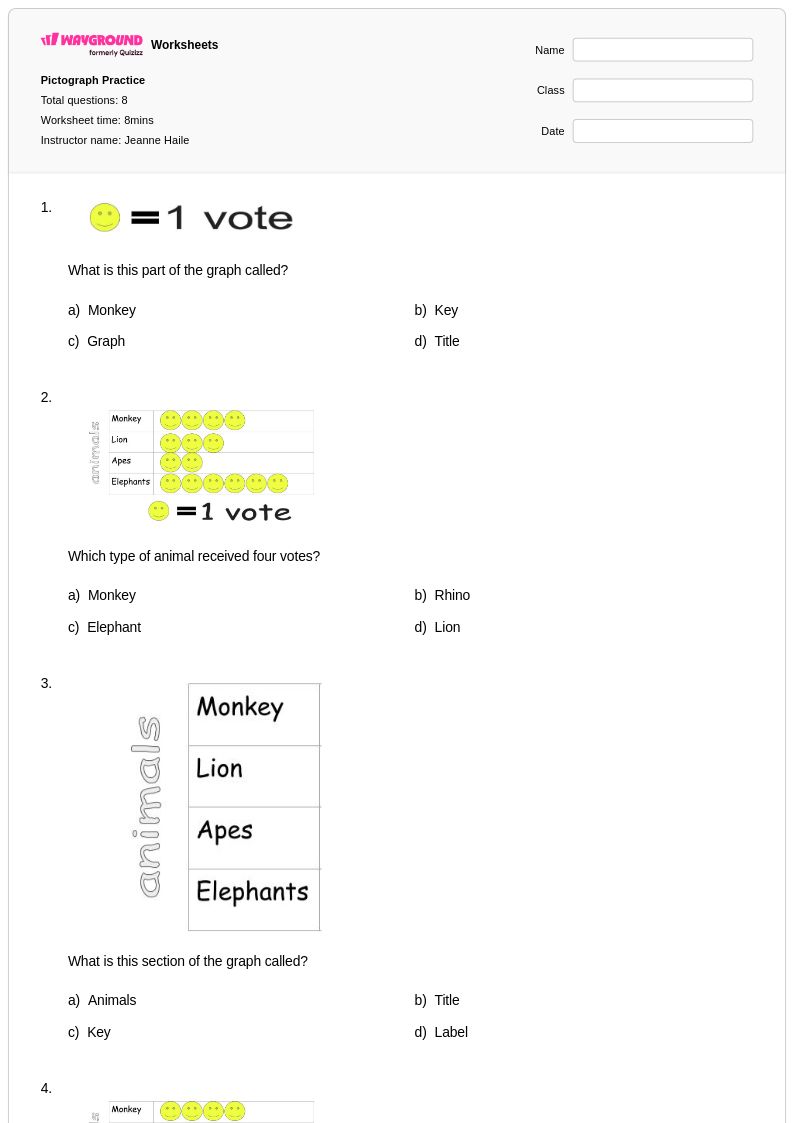
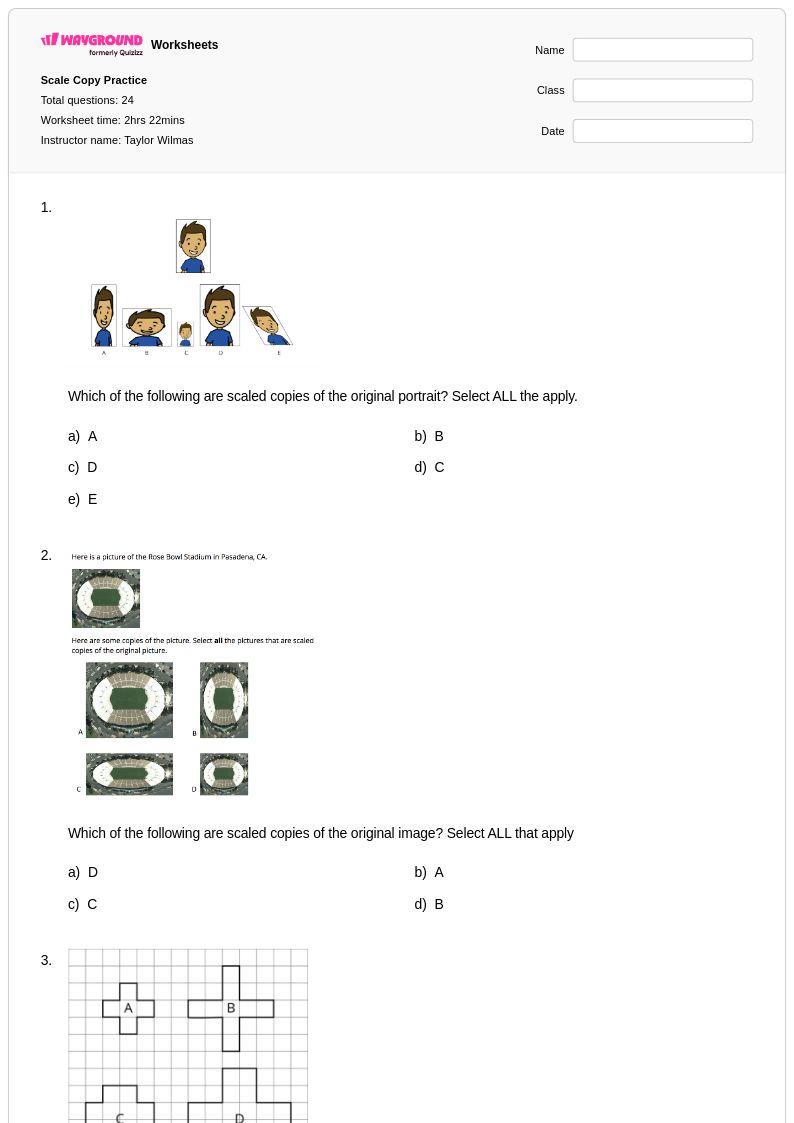
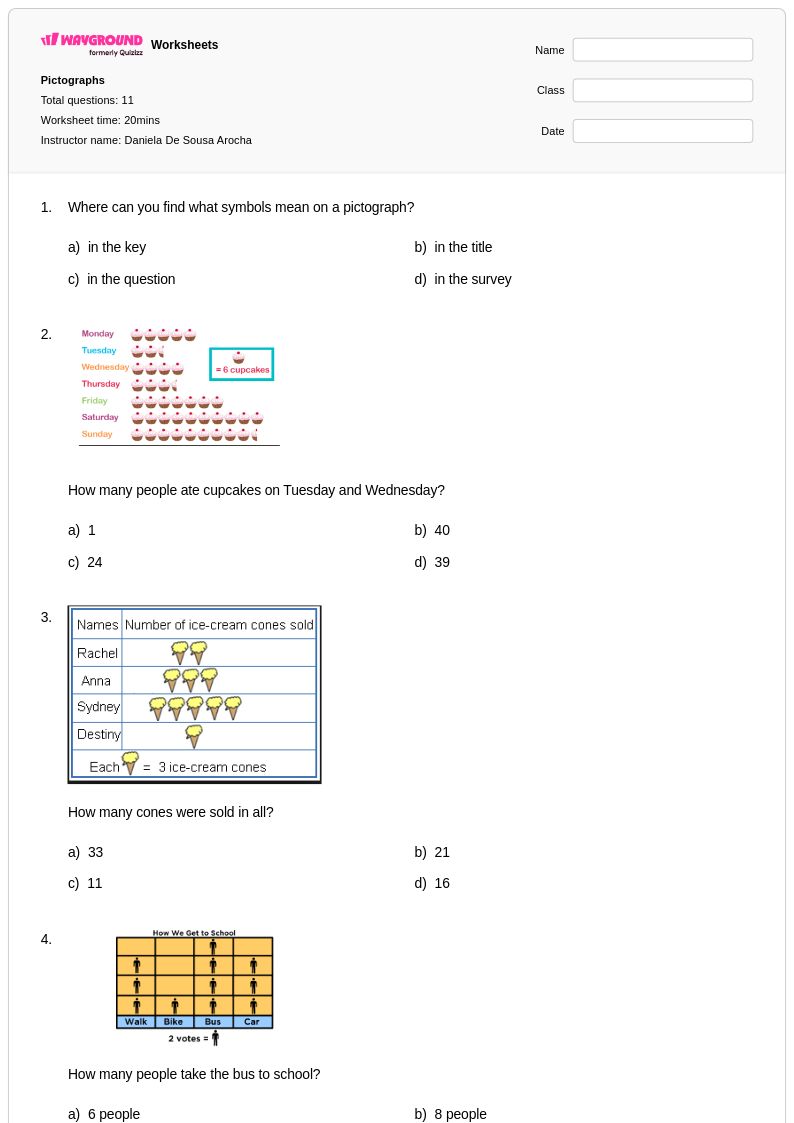
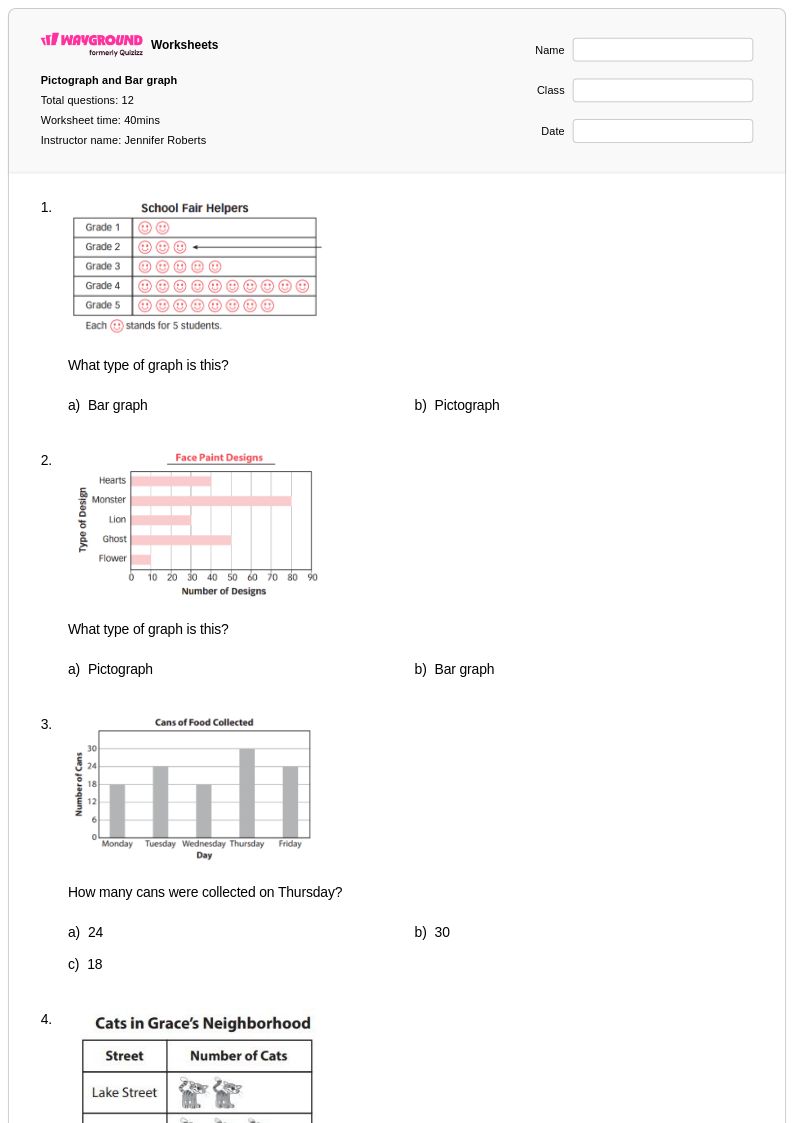
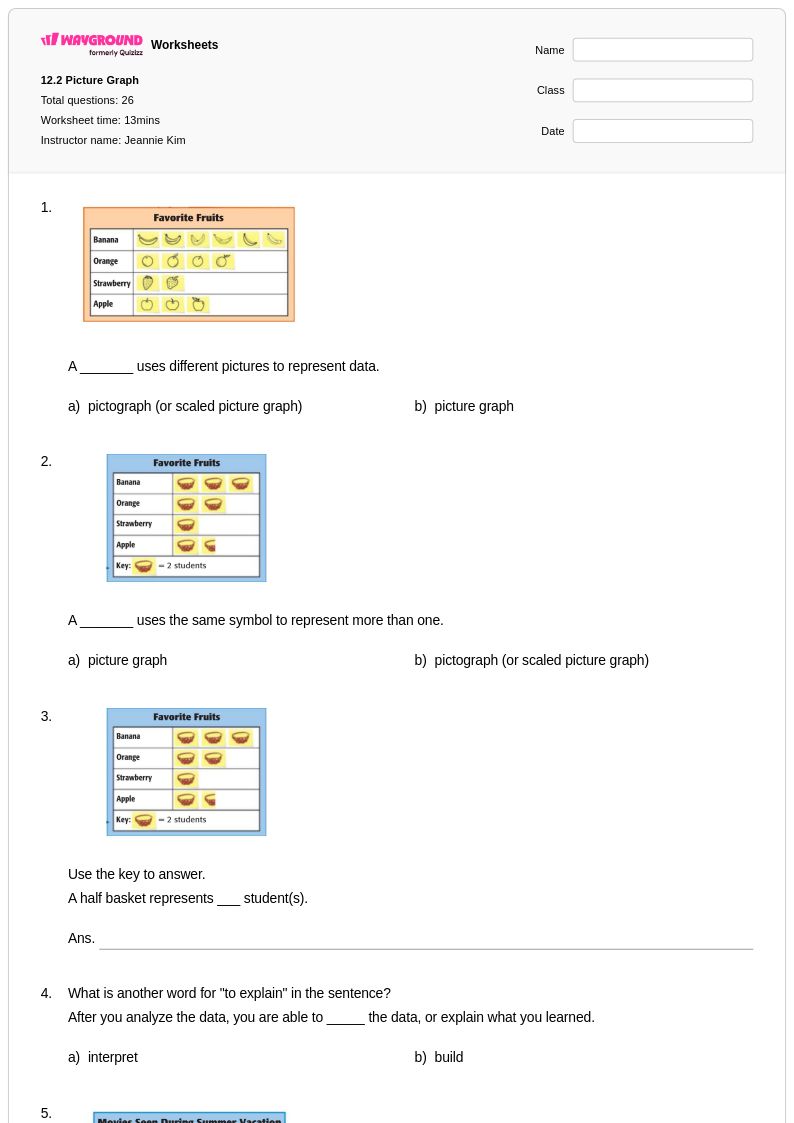
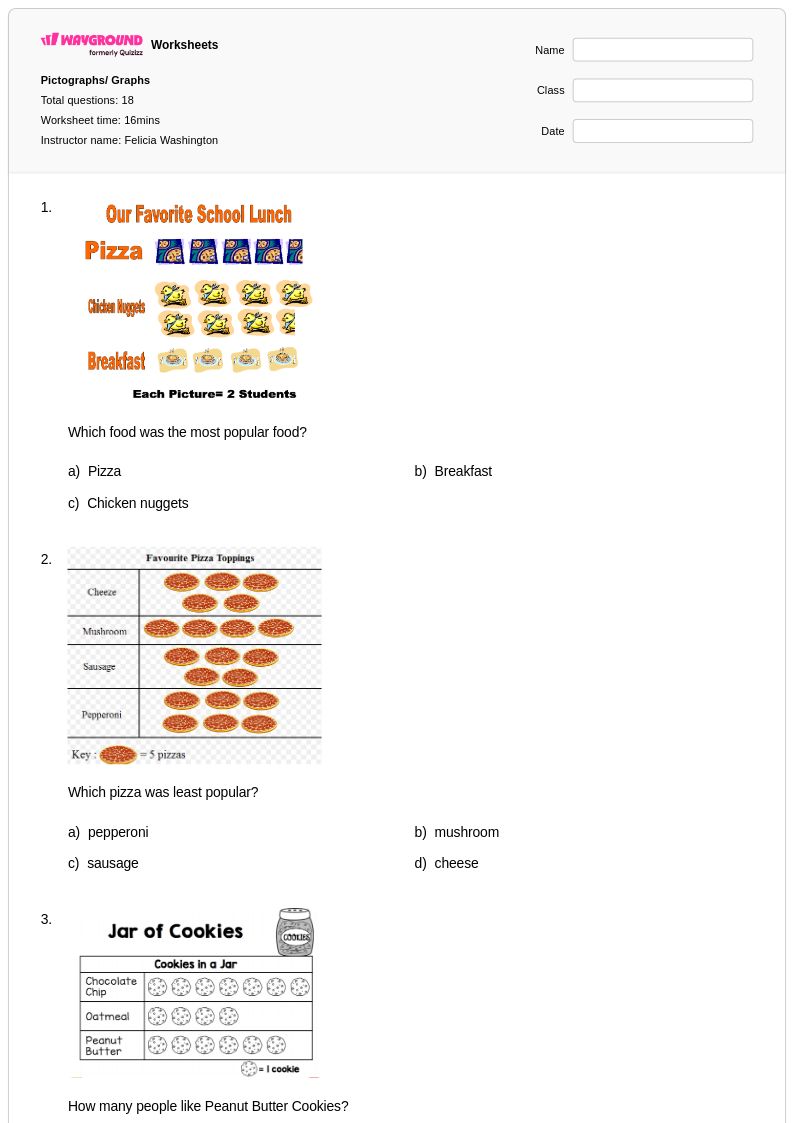
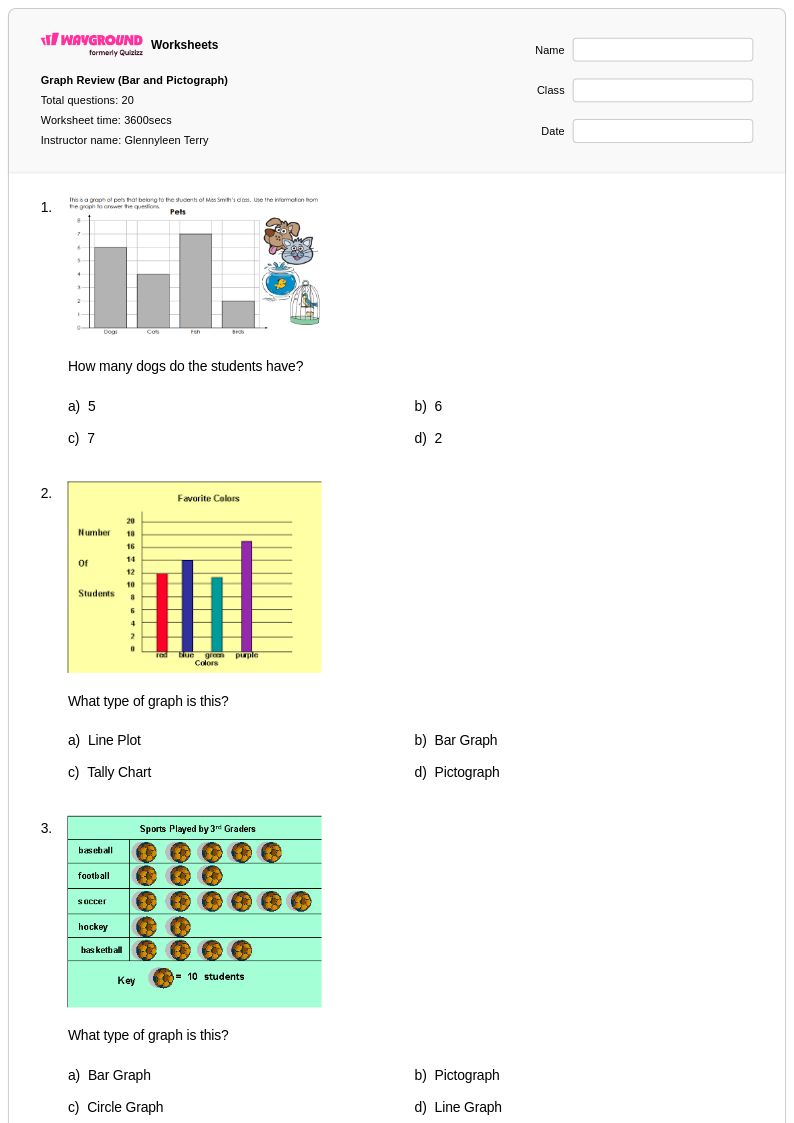
Wayground's free scaled pictographs worksheets and printables help students master data interpretation skills through engaging practice problems that teach reading and creating pictographs with various scales, complete with answer keys.
Scaled pictographs worksheets from Wayground (formerly Quizizz) provide comprehensive practice for students learning to interpret and create data visualizations where each symbol represents multiple units. These mathematics worksheets strengthen essential data analysis skills by teaching students to read pictograph keys, calculate totals using scale factors, and construct their own scaled representations of numerical data. Each worksheet collection includes detailed answer keys and is available as free printable pdf resources, featuring practice problems that progress from simple whole-number scales to more complex fractional representations that challenge students to think critically about data relationships.
Wayground (formerly Quizizz) supports mathematics educators with millions of teacher-created scaled pictographs resources that can be easily searched and filtered by specific learning objectives and skill levels. The platform's robust differentiation tools allow teachers to customize worksheets for diverse learners, while standards alignment ensures that practice problems target essential mathematics benchmarks for data interpretation and graphical literacy. These flexible resources are available in both printable pdf format and interactive digital versions, enabling teachers to seamlessly integrate scaled pictograph practice into lesson planning, provide targeted remediation for struggling students, offer enrichment opportunities for advanced learners, and deliver consistent skill reinforcement across various instructional contexts.
FAQs
How do I teach scaled pictographs?
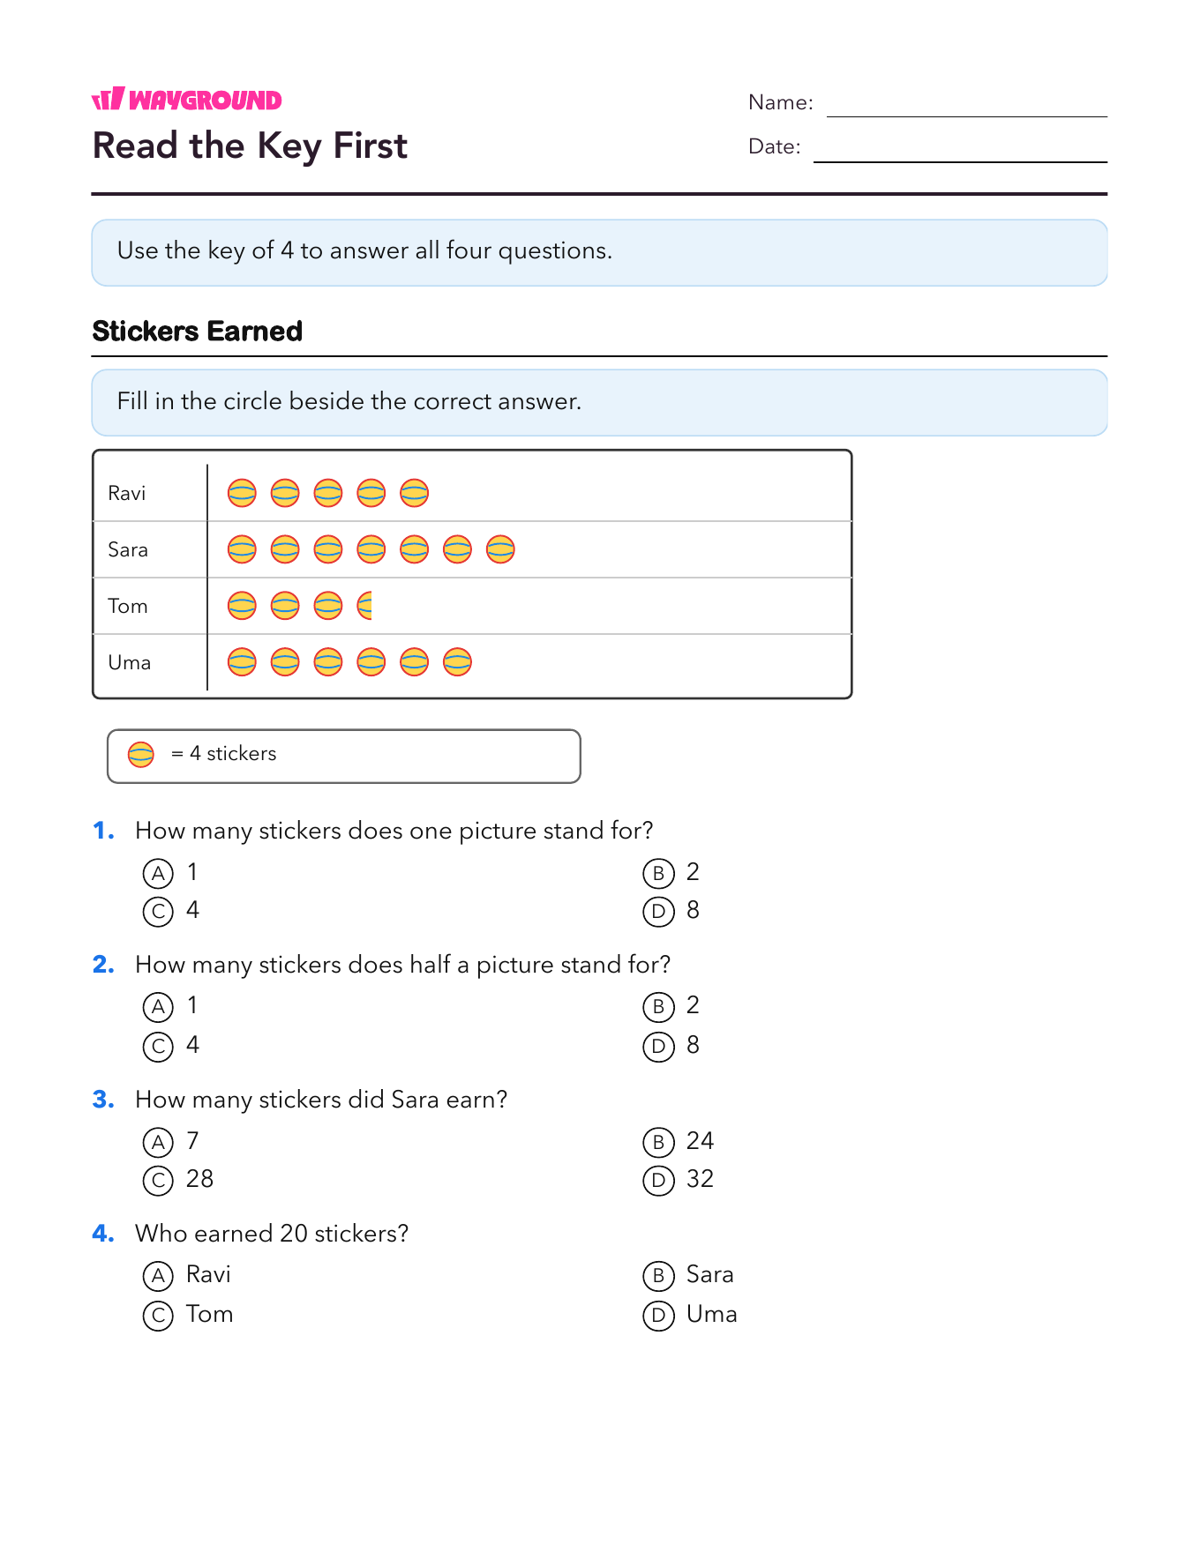
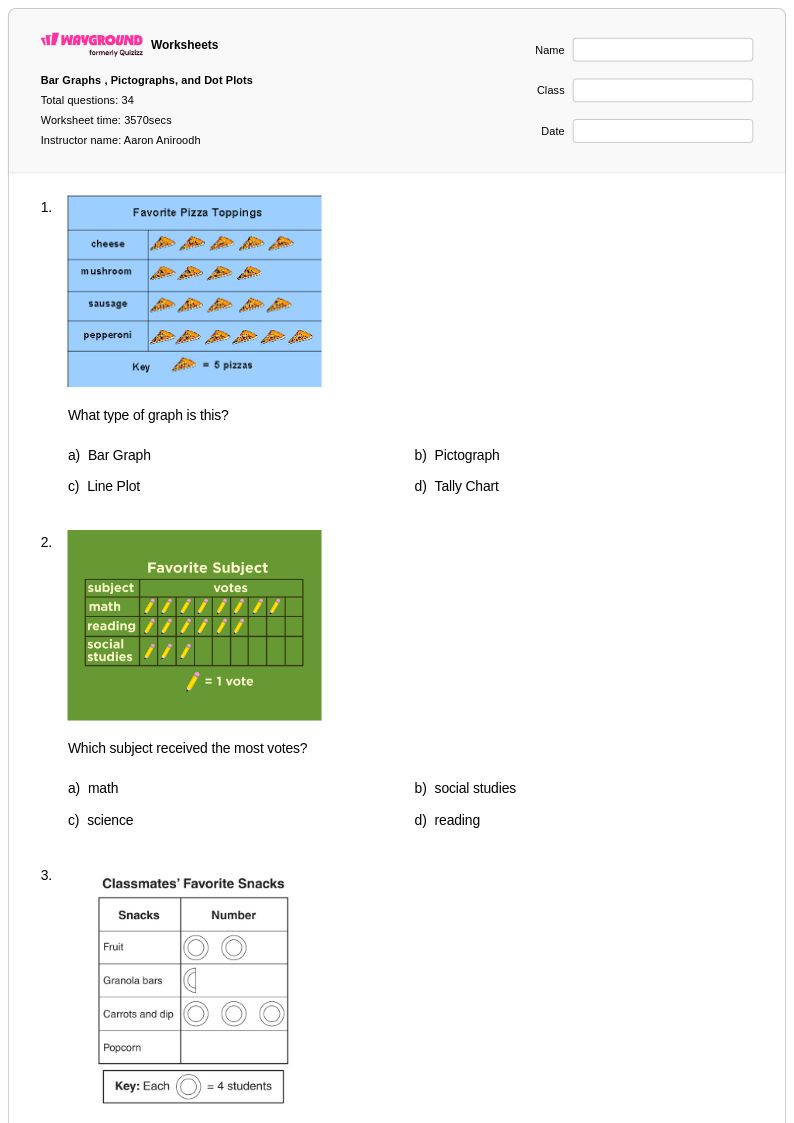
Start by connecting to students' prior knowledge of one-to-one pictographs. Introduce a simple scale (e.g., one symbol = 2 items) using concrete objects like blocks before moving to the worksheet. Emphasize the importance of always reading the key first, as it's the 'secret code' to understanding the graph.
What exercises help students practice reading scaled pictographs?
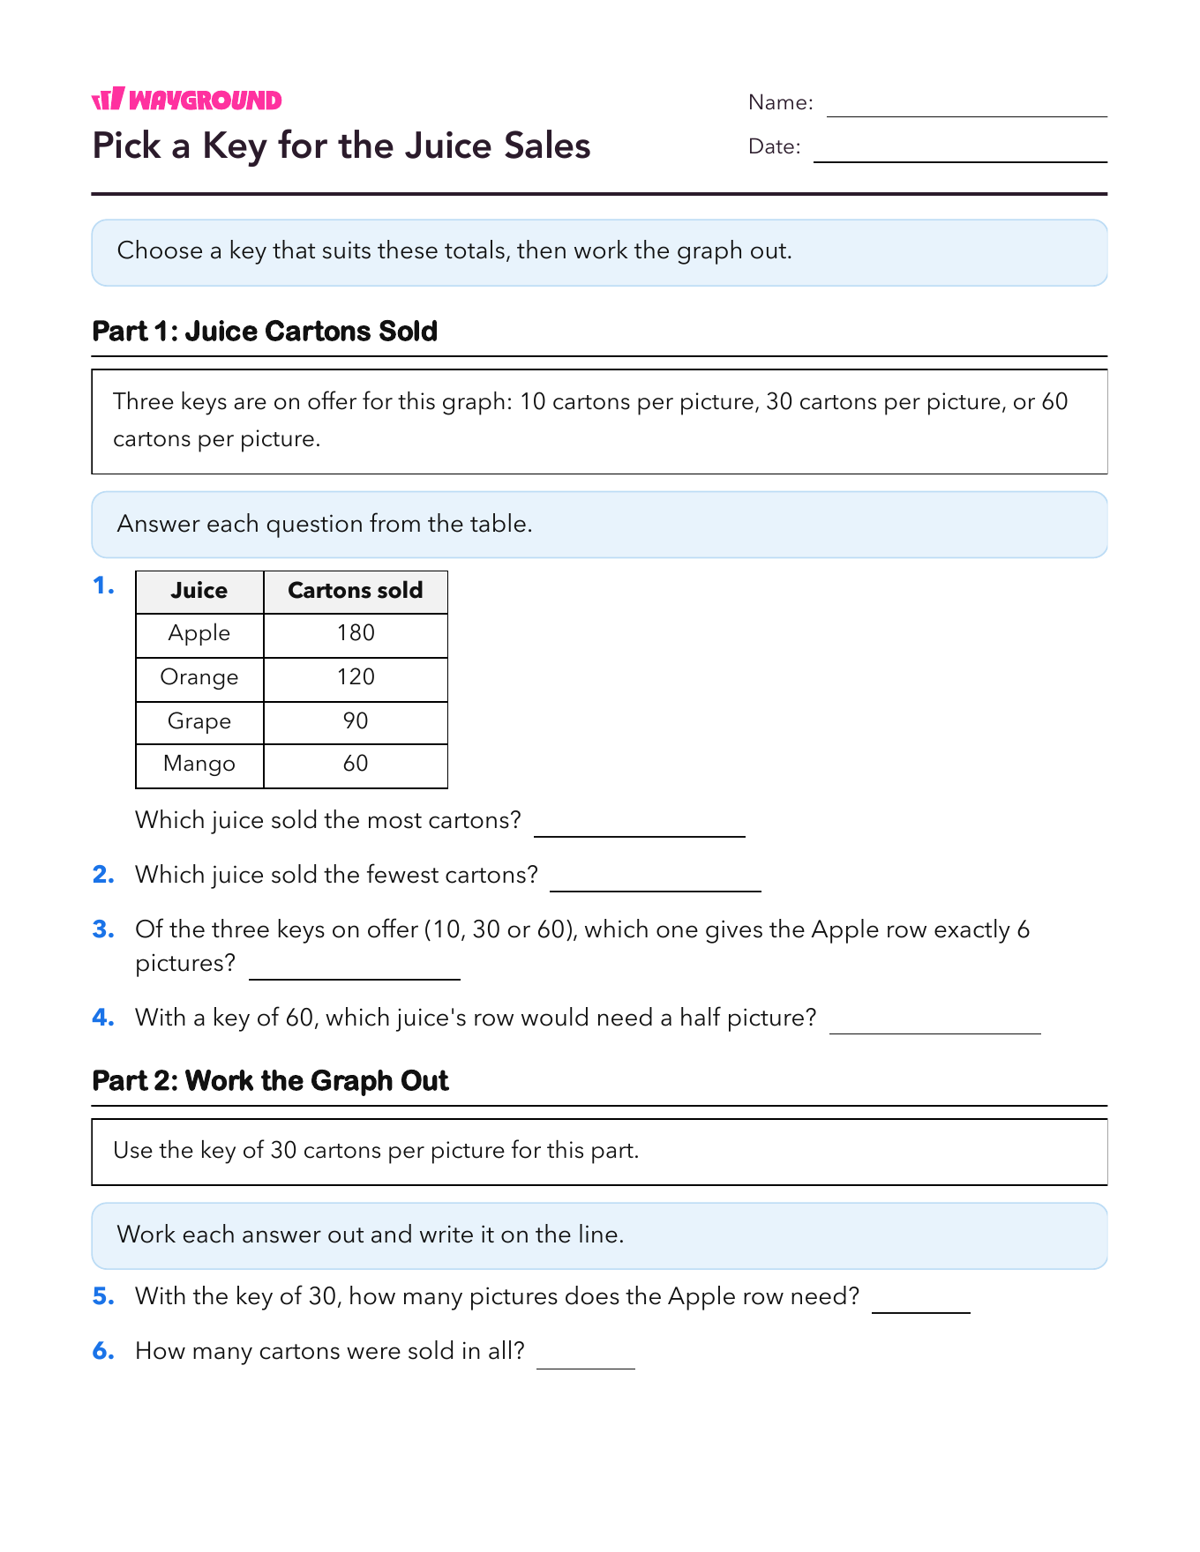
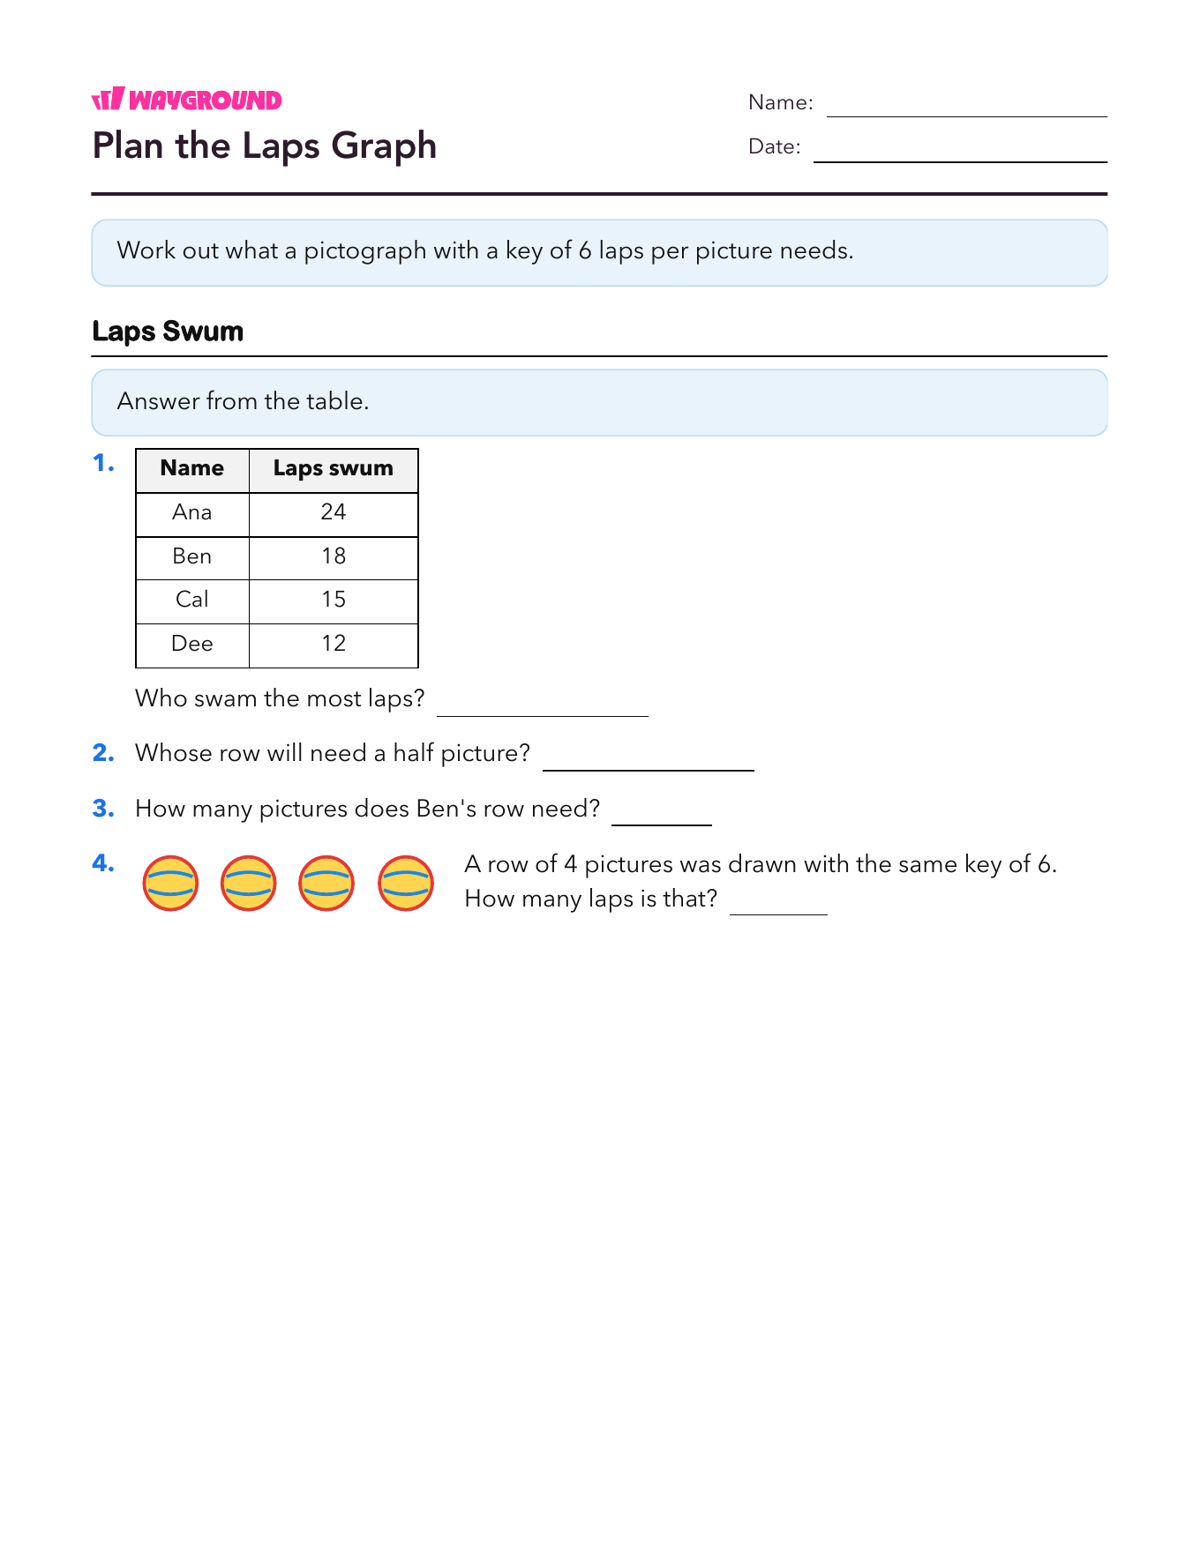
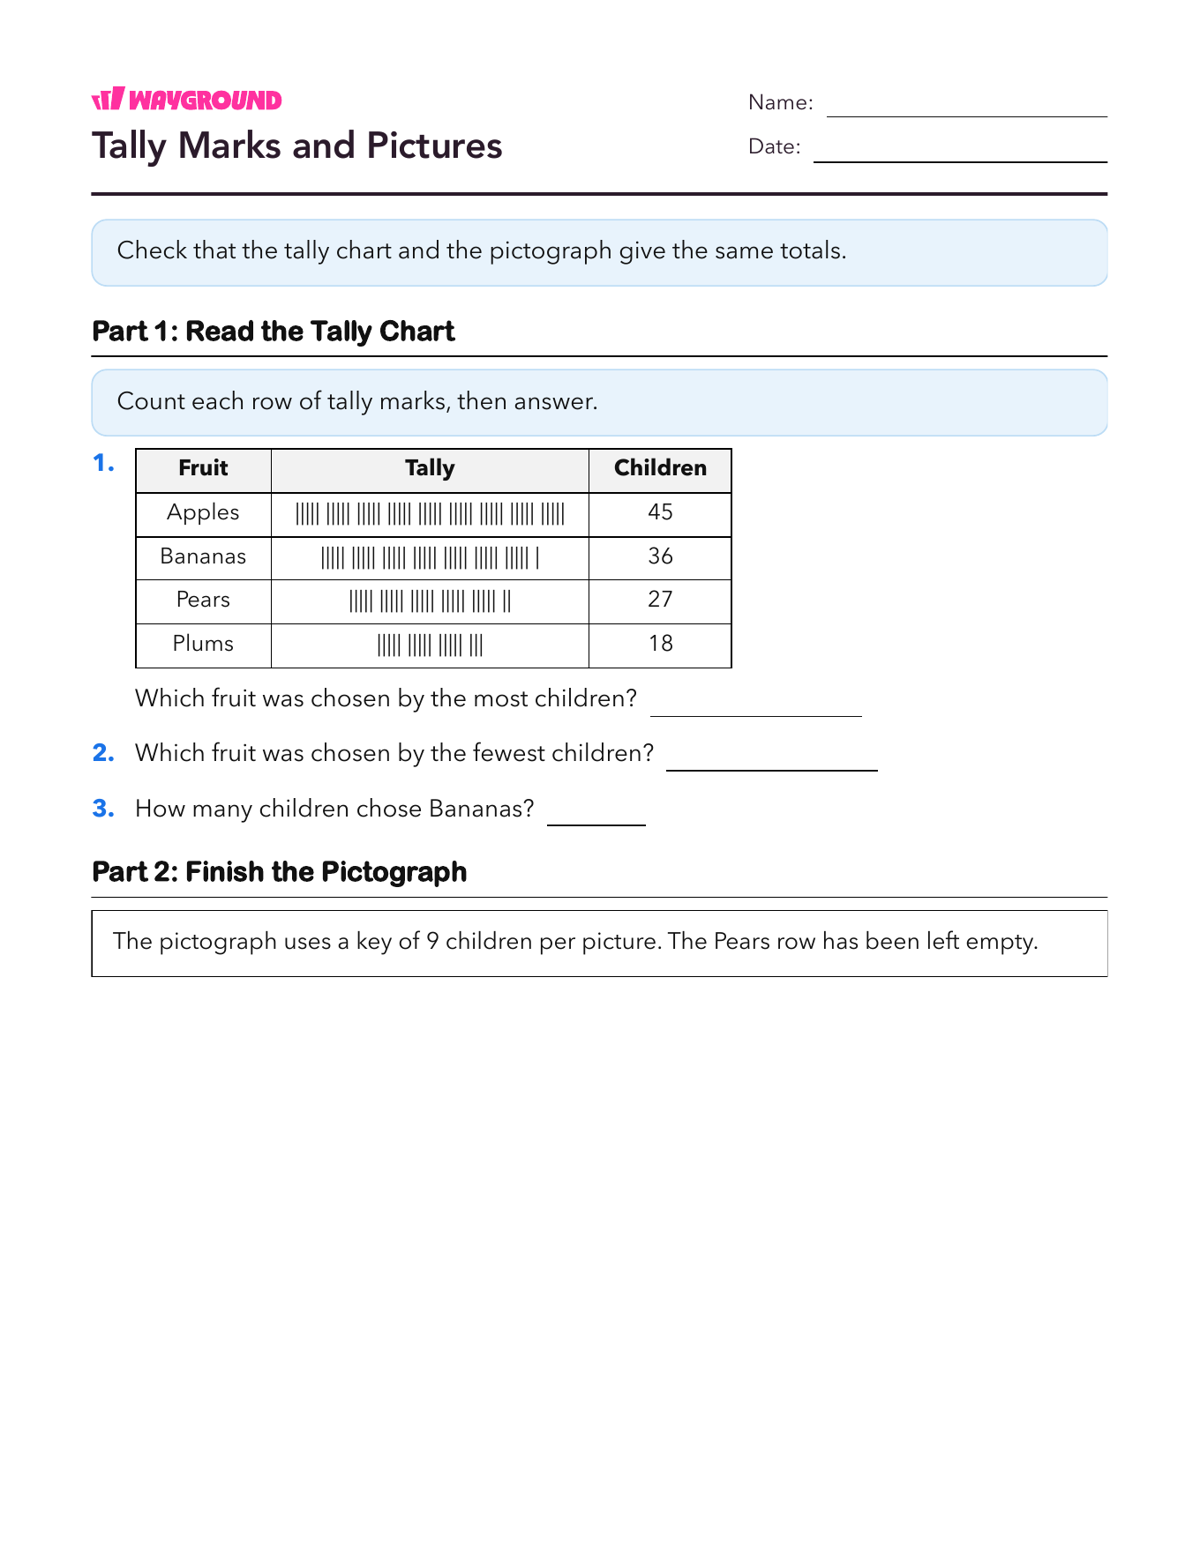
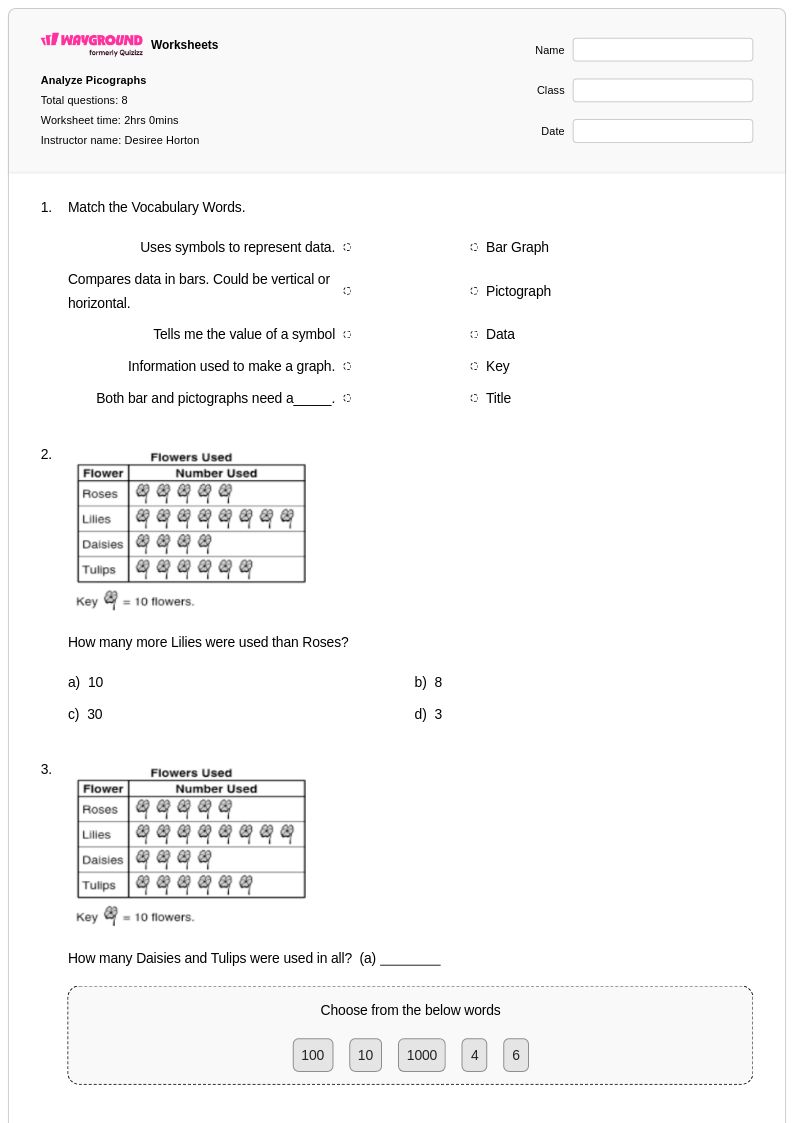
Effective practice involves a progression of skills. Start with worksheets that ask students to find the total value for a single category. Then, move to problems requiring them to compare two categories ('How many more...?') or calculate the total for the entire data set. Finally, challenge them to create their own pictograph from a given data table.
What are common mistakes students make with scaled pictographs?
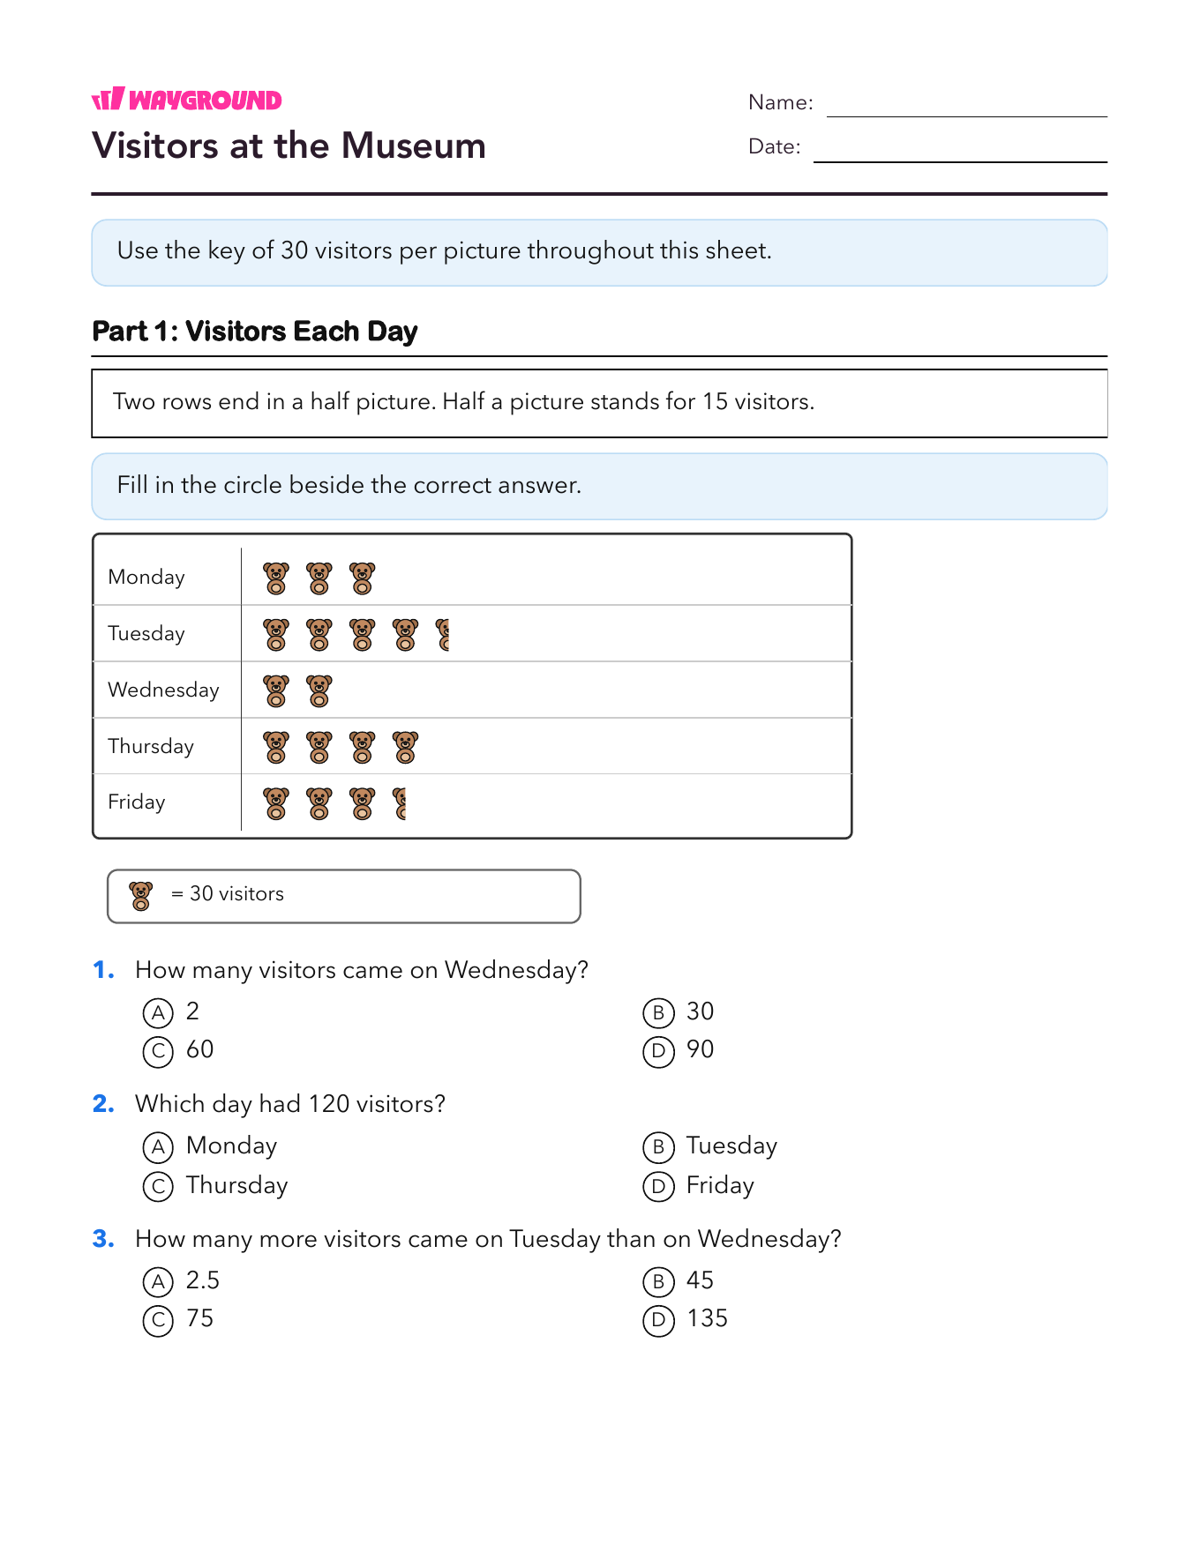
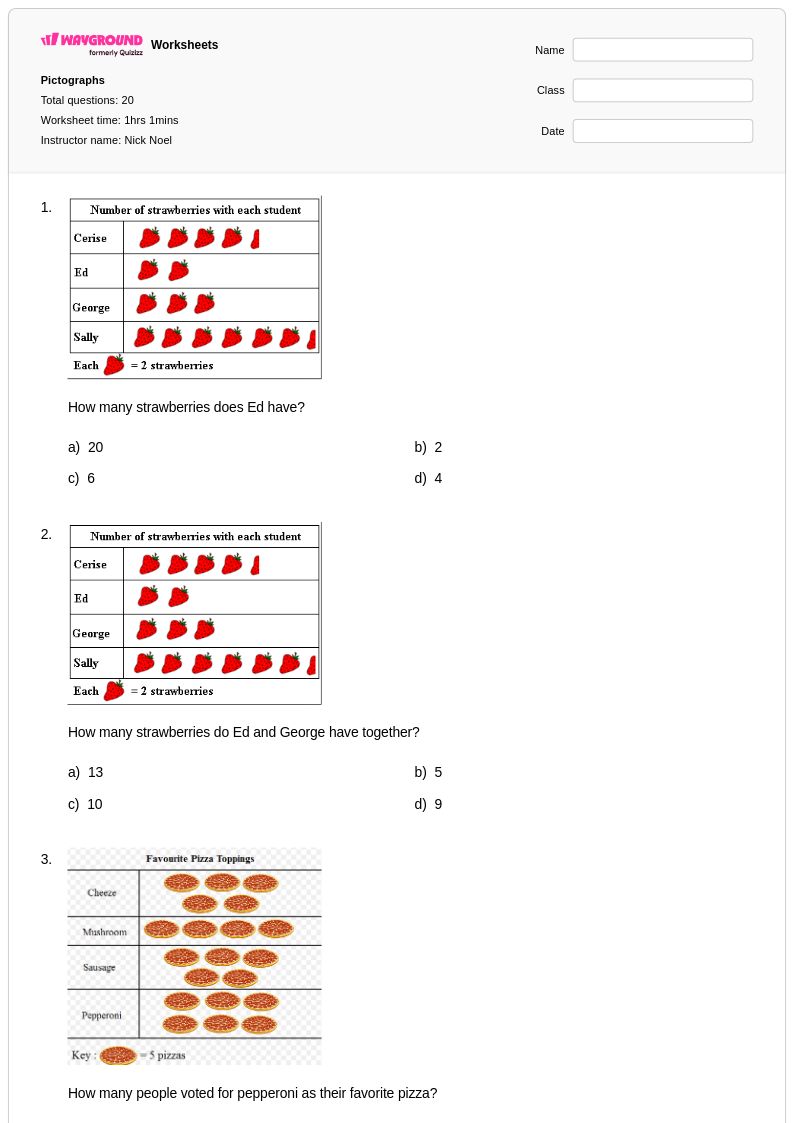
The most frequent error is forgetting to use the scale factor; students count the symbols and report that number as the answer. Another common mistake is misinterpreting partial symbols, such as a half-circle representing half the scale's value. Watch for simple multiplication errors when the scale is a larger number like 10 or 100.
How can I use this scaled pictographs worksheet in my class?
This worksheet can be assigned as a digital quiz on Wayground or printed as a PDF for hands-on practice. The digital format is auto-graded, while the printable version allows you to grade student work using the Wayground for Teachers mobile app. Every worksheet includes a complete answer key for quick checking.
How do scaled pictographs fit into the math curriculum?
Aligned with Common Core standards for measurement and data, scaled pictographs are a critical step up from the one-to-one correspondence graphs learned in earlier grades. This topic builds foundational data literacy and multiplicative reasoning, preparing students for more complex data representations like scaled bar graphs and line plots.
How can I differentiate this topic for my students?
For students needing support, use Wayground's features to reduce the number of answer choices on multiple-choice questions or activate Read Aloud for word problems. For a challenge, ask advanced learners to create a new pictograph from the same data but with a different scale, prompting them to consider how the choice of scale affects the graph's appearance.