
 Worksheets
Interpreting Position and Speed Graphs
Total questions: 42
Worksheet time: 2hrs 4mins

Hint: Think straight line
Hint: Greatest distance shortest time




The graph shows four cows making their way back to the barn. Which cow started ahead of the others?
Elsie
Bessie
Moolinda
Dolly

The graph shows four cows making their way back to the barn. Which cow was fastest?
Elsie
Bessie
Moolinda
Dolly

This graph shows
An object stopped
An object speeding up
An object moving at constant speed

This graph shows
An object stopped
An object slowing down
An object moving at constant speed

At what point on the graph is the object traveling at a constant speed?
A
B
C
At what point on the graph does the object have the greatest change in speed?
A
B
C
At what point on the graph is the object slowing down?
B
C
D

The graph below represents the motion ball rolling across the floor of a room. The average speed of the ball is:
0.5 m/s
2 m/s
5 m/s
50 m/s

The graph represents the motion of two cars, A and B. During the time from t = 0 seconds to t = 5 seconds, car A is:
moving with constant speed.
moving with increasing speed.
moving with decreasing speed.
motionless; not moving.

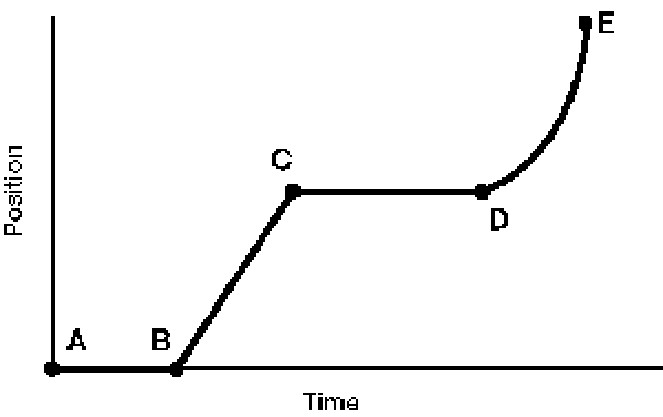
The graph below was created from data taken as a runner was warming up for a track meet. The interval during which the runner is moving fastest is: (Hint: Think Slope!)
AB
BC
CD
DE

The graph below represents the motion of an object. The speed of the object is changing (not constant) during interval:
AB
BC
CD
DE

According to the graph in Figure 12-1A, during the first 4 seconds, the car is:
motionless; not moving.
moving with constant speed.
moving with decreasing speed.
According to the graph in Figure 12-1A, during the last 2 seconds, the car is:
motionless; not moving.
moving with constant speed.
moving with increasing speed.
moving with decreasing speed.

The graph shows the total distance that a dog walked in 10 s. The dog did not walk the same distance each second. During which period in time did the dog stop moving?
0-2 seconds
3-6 seconds
2-3 seconds
6-10 seconds
Looking at the graph above. What was the dogs average speed? (Hint: use the graph to determine the total distance and total time)
8.0 m/s
10 m/s
80 m/s
.8 m/s

Figure 2 summarizes the motion of an object. Which of the following statements best describes the motion of the object?
The object moved at a constant speed.
The object accelerated at a constant rate.
The average speed of the object was less than 1 m/s.
The instantaneous speed of the object was greater than 1 m/s.

Figure 1 summarizes the motion of an object. During which time interval was the object moving fastest?
0 to 1 s
2 s to 3 s
1 s to 2 s
3 s to 4 s

Figure 4 summarizes the motion of a car. Which term best describes the velocity of the car?
0.2 h
50 km/h East
10 km East
500 km/h2

