
 Worksheets
Unit 9: Interdependence in Ecosystems - Review
Total questions: 66
Worksheet time: 53mins
Name
Class
Date
1.

symbiotic relationship in which both organisms benefit
a)
competition
b)
Mutualism
c)
nitrogen fixation
d)
energy pyramid
2.

A living relationship between two species in which one organism is harmed is called...
a)
mutualism
b)
commensalism
c)
parasitism
d)
niche
3.
The nonliving aspects of an ecosystem.
a)
Abiotic factors
b)
Biotic factors
4.
The living portions of the ecosystem.
a)
Biotic factors
b)
Abiotic factors
5.
Water temperature would be an example of ...
a)
A biotic factor
b)
An abiotic factor
6.
A collection of organisms that belong to different populations but all live in the same area and interact with one another.
a)
Population
b)
Ecosystem
c)
Community
d)
Ecosphere
7.
A place where an organism lives.
a)
Terrain
b)
Habitat
c)
Community
d)
Population
8.
A collection of organisms that make up a community as well as all of the nonliving aspects of the environment.
a)
Population
b)
Community
c)
Habitat
d)
Ecosystem
9.
What is the major difference between a community and an ecosystem?
a)
A community involves only the biotic, not the abiotic
b)
An ecosystem only includes herbivores and carnivores-- no decomposers
c)
An ecosystem involves only the biotic, AND THE abiotic
d)
An ecosystem is just a larger community
10.
What are the major differences between a species and a population?
a)
Populations consist of ALL of the individual organisms within a species in a given area/ecosystem that are fertile
b)
Populations are a collection of many different types of species that are not related to each other
c)
Populations are just a larger amount of individuals
d)
Populations are the number of individuals within a species that are identical
11.

Different populations living and interacting with each other in the same area
a)
Biome
b)
Ecosystem
c)
Community
d)
Niche
12.

which symbiosis is this
a)
parasitism
b)
mutualism
c)
commensalism
d)
nonalism
13.
The range of all conditions in which a species lives and how it gets what it needs to survive and reproduce.
a)
population
b)
ecosystem
c)
niche
d)
biology
14.
A group of ecosystems that share similar climates and types of organisms
a)
Population
b)
Species
c)
Biome
d)
Community
15.
Consists of all life on Earth and all parts of the Earth in which life exists
a)
Biosphere
b)
Species
c)
Community
d)
Population
16.
The scientific study of the interactions between organisms and between organisms and their surroundings
a)
Research Methods
b)
Biome
c)
Ecology
d)
Biology
17.
A group of individuals that belong to the same species and live in the same area
a)
Community
b)
Family
c)
Species
d)
Population
18.

What number represents populations?
a)
3
b)
4
c)
5
d)
6
19.

What number represents community?
a)
1
b)
2
c)
3
d)
4
20.

What number represents ecosystem?
a)
1
b)
2
c)
3
d)
4
21.
Any environmental factors that happens in an ecosystem that causes a population w to decrease.
a)
Carrying Capacity
b)
Limiting Factors
c)
Population Density
d)
Birth Rate
22.

The total number of individuals a habitat can survive with the resources it has available.
a)
Carrying capacity
b)
Limiting factors
c)
Resources
d)
Population
23.

What is the carrying capacity of the following graph?
a)
1000
b)
8000
c)
800
d)
600
24.

What type of growth is represented in this graph?
a)
exponential
b)
logistic
c)
a good kind
d)
representative
25.

What type of growth is represented by this graph?
a)
exponential
b)
logistics
c)
a good kind
d)
representative
26.
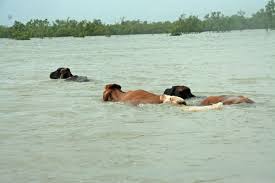
Excessive amounts of rain caused a flood in the southwest United States that resulted in substantial amounts of deaths in the rabbit population? This situation is an example of a density _____________ limiting factor.
a)
density-independent
b)
density-dependent
c)
density- too high
d)
density- too low
27.
Natural disasters can be considered limiting factors.
a)
true: density independent limiting factors
b)
false; natural disasters are not limiting factors
c)
true: density dependent limiting factors
d)
false: because Mrs. Howard said
28.
Which of the folowing are two ways a population can decrease in size?
a)
Death Rate/Immigration
b)
Birth Rate/ Emmigration
c)
Death Rate/Emmigration
d)
Birth Rate/Immigration
29.
Creates a J-Shaped Curve
Shows Population Growth With No Limits
Unlimited Resources
No Limiting Factors
The information above explains what type of population growth curve?
Shows Population Growth With No Limits
Unlimited Resources
No Limiting Factors
The information above explains what type of population growth curve?
a)
Exponential Growth Curve
b)
Logistic Growth Curve
c)
Sideways Growth Curve
d)
Upside Down Growth Curve
30.
Creates a S-Shaped Growth Curve
Usually starts with an Exponential Growth Phase
Population Growth Levels Out at Carrying Capacity
Realistic
Regulated by Density Dependent Limiting Factors
The information above explains what type of population growth curve?
Usually starts with an Exponential Growth Phase
Population Growth Levels Out at Carrying Capacity
Realistic
Regulated by Density Dependent Limiting Factors
The information above explains what type of population growth curve?
a)
Logistic Growth Model
b)
Exponential Growth Model
c)
Sideways Growth Model
d)
Upside Down Growth Model
31.

If the amount of food or resources available increases, the carrying capacity for an animal:
a)
Stays the same
b)
Increases
c)
Decreases
d)
Fluctuates
32.
What will happen to the population when the birth rate is larger than the death rate?
a)
grow
b)
shrink
c)
stay the same
33.
An environmental factor such as predation, disease, and competition that depends on the number of members in a population per unit
a)
dispersion
b)
density- independent factor
c)
density- dependent factor
d)
population growth rate
34.
What does a limiting factor do?
a)
makes a population grow large
b)
stops a population from growing large
c)
helps organisms adapt to abiotic factors
d)
provides geographical boundaries for migration
35.
Which of the following is an EXAMPLE of a density-dependent limiting factor?
a)
Water
b)
Major flood.
c)
Migration
d)
Thick fur
36.
What is population density?
a)
The number of people living across Europe.
b)
The number of plants occupying an area.
c)
The number of people living in an area.
d)
The number of insects in an ecosystem.
37.
As a population reaches its carrying capacity, there may be an increase in competition for
a)
food
b)
shelter
c)
mates
d)
all the above
38.
A new strain of influenza (the flu) breaks out in New York City.
a)
density-dependent
b)
density-independent
39.

symbiotic relationship in which one organisms benefits and the other organism is not affected
a)
invasive (non-native) species
b)
mutualism
c)
nitrogen fixation
d)
commensalism
40.
Which dispersion pattern is described by organisms being spaced out equally?
a)
Uniform
b)
Random
c)
Clumped
d)
None of these
41.
Which dispersion pattern usually is a result of resources not being evenly spread out in the environment?
a)
Uniform
b)
Random
c)
Clumped
d)
None of these
42.

Which kind of dispersion is #1?
a)
clumped
b)
random
c)
uniform
43.

Which survivorship curve represents a species where most of the individuals live through their lives and die of old age?
a)
Type 1
b)
Type 2
c)
Type 3
44.

The picture above shows what type of dispersion?
a)
random
b)
uniform
c)
clumped
d)
even
45.

The image above shows _______________ dispersion.
a)
clumped
b)
scattered
c)
uniform
d)
random
46.

What type of dispersion is shown in the image above?
a)
even
b)
clumped
c)
random
d)
uniform
47.
Exponential graphs level out because the population has hit its carrying capacity.
a)
True
b)
False
48.
A population hit its maximum carrying capacity 2010. The population went on a steady decline for several years, but rebounded shortly after. A graph used to represent this data would be a ________________ graph.
a)
exponential
b)
carrying capacity
c)
double line
d)
logistic
49.
Organisms that lay eggs, do no nurturing of their young and are adults for only short periods of time:
a)
Type 1
b)
Type 2
c)
Type 3
d)
Zebras
50.
Organisms that either die at birth or get eaten as eggs show this type of survivorship.
a)
Type 1
b)
Type 2
c)
Type 3
d)
Elephants
51.
Organisms that have gestation (pregnancy) periods and usually only give birth to one offspring at a time.
a)
Type 1
b)
Type 2
c)
Type 3
d)
Foxes
52.
Most organisms of this type reach adulthood and will go on to reproduce themselves.
a)
Type 1
b)
Type 2
c)
Type 3
d)
Insects
53.
Organisms that have a 50/50 shot as survival at any given point during their lifespan.
a)
Type 1
b)
Type 2
c)
Type 3
d)
Type 4
54.
Humans are an example of this type of survivorship.
a)
Type1
b)
Type 2
c)
Type 3
d)
Type 4
55.
Which organism would show type 3 survivorship?
a)
Gorillas
b)
Rabbits
c)
Mice
d)
Beetles
56.
Which is NOT an example of a limiting factor.
a)
Climate
b)
Available Food & Water
c)
Available Space & Shelter
d)
Species color
57.
When nitrogen gas is turned in to a form that plants and animals can use is called
a)
Combustion
b)
Photosynthesis
c)
Decomposition
d)
Nitrogen Fixation
58.

What is this a picture of?
a)
Nitrogen cycle
b)
carbon cycle
c)
water cycle
d)
plant cycle
59.
How does carbon dioxide leave the atmosphere?
a)
Through transpiration
b)
Through photosynthesis
c)
Through factory emission
d)
Sunlight
60.
Carbon dioxide is added to the atmosphere by
a)
Burning fossil fuels
b)
Cellular respiration
c)
Decomposing organic matter
d)
All answers are correct
61.
The nitrogen found in the atmosphere is not in a form that plants or animals can use. What converts it into a usable form?
a)
Bacteria
b)
Photosynthesis
c)
Decomposition of organisms
d)
Fungi
62.

Identify the cycle pictured.
a)
The Water cycle
b)
The Carbon cycle
c)
The Nitrogen cycle
d)
This is not a correct diagram of any cycle.
63.

The process represented by arrow 2 is _
a)
transpiration
b)
evaporation
c)
condensation
d)
precipitation
64.
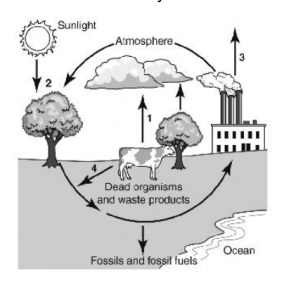
What is happening at 1?
a)
respiration: releasing CO2
b)
decomposing CO2 in the soil
c)
photosynthesis: absorbing CO2
d)
turning CO2 from the atmosphere into organic molecules
65.
Identify the cycle pictured.
a)
The Water cycle
b)
The Carbon cycle
c)
The Nitrogen cycle
d)
This is not a correct diagram of any cycle.
66.

Identify the cycle pictured.
a)
The Water cycle
b)
The Carbon cycle
c)
The Nitrogen cycle
d)
This is not a correct diagram of any cycle.
100 %

