Wayground logo

Free Printable Worksheets

Font size

S
M
L
XL
Worksheets

science skills

Total questions: 80

Worksheet time: 1hrs 28mins

Name
Class
Date
1.
What is a hypothesis?
a)
An observation
b)
A bar graph
c)
Facts
d)
A prediction of what will happen 
2.
What is an inference?
a)
A hypothesis
b)
An educated guess using what you already know
c)
Facts
d)
Observation
3.
A graduated cylinder and a beaker are both tools that help measure what?
a)
Length
b)
Width
c)
Details
d)
Volume
4.
Information that you obtain through your senses
a)
hypothesis
b)
observation
c)
experiment
5.
Instrument that measure temperature
a)
thermometer
b)
speedometer
c)
tape measure
6.
Scientists can organize their data by using data ____ and ____
a)
volume & proportion
b)
tables & graphs
c)
force and motion
7.
A student is planning an experiment to find out how the height from which he drops a ball affects how high the ball bounces. What is the control variable?
a)
The ball used
b)
The height the ball bounces
c)
Height of the ball being dropped
8.
An experiment is performed on plants to see how different liquids affect plant growth. Each plant in the experiment is given a different liquid; water, apple juice, or milk. Each plant has the same amount of soil, sunlight, and listens to the same music. In this investigation, the independent variable is ...
a)
The type of plant
b)
The amount of sunlight
c)
The type of music
d)
The type of liquid
9.
Any factor that can change in an experiment
a)
variable
b)
constant
c)
independent
d)
dependent
10.
The variable that is being tested or changed
a)
independent variable
b)
dependent variable
c)
control variable
11.
The variable that is being measured
a)
independent variable
b)
dependent variable
c)
control variable
12.
the variable that is kept the same to make sure results are caused by the thing being tested
a)
independent variable
b)
dependent variable
c)
control variable
13.
According to the pie chart, the United States relies on fossil fuels for about what percentage of its energy?
a)
30%
b)
45%
c)
60%
d)
80%
14.
What is the relationship between the independent variable and the dependent variable?
a)
As time increase, distance decreases
b)
As time increases, distance increases
c)
As time decreases, distance decreases
d)
As time decreases, distance increases
15.
The Independent/Manipulated Variable goes on the ___ axis
a)
x
b)
y
16.
Which type of graph would you create for this data table?
a)
Bar
b)
Line
17.
Which type of graph would you create for this data table?
a)
Bar
b)
Line
18.
Which would go on the y-axis?
a)
Time
b)
# of Bacteria 
19.
This type of graph is used to _______
a)
Compare different "groups"
b)
Compare something over time
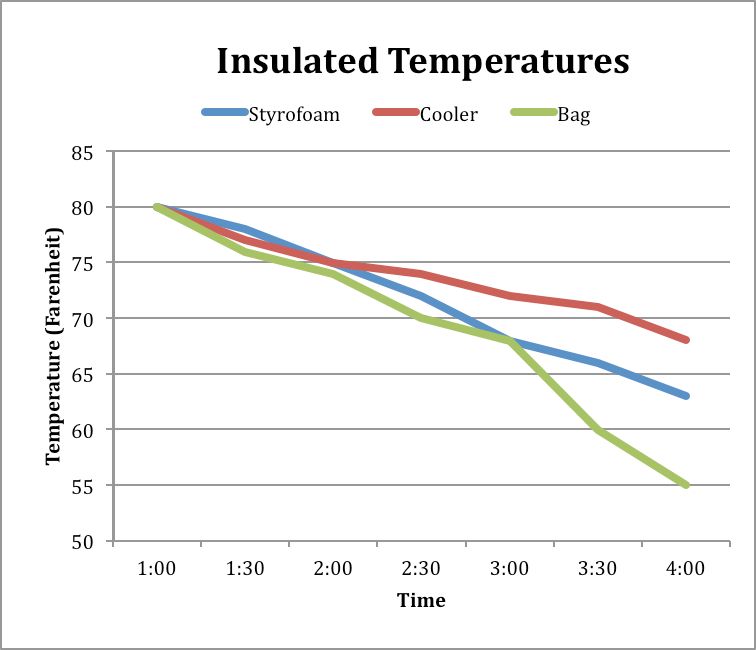
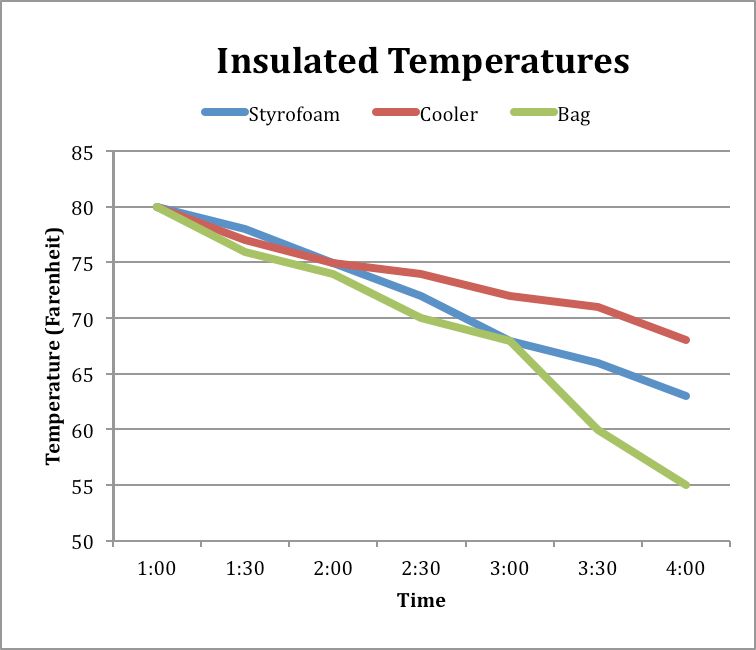
20.

What data does this graph represent?

a)

Change in temperature of a liquid over time in 3 different containers

b)

How temperature can change the molecules in a material

c)

The phase changes of a material

d)

What type of container people use the most to store hot liquids.

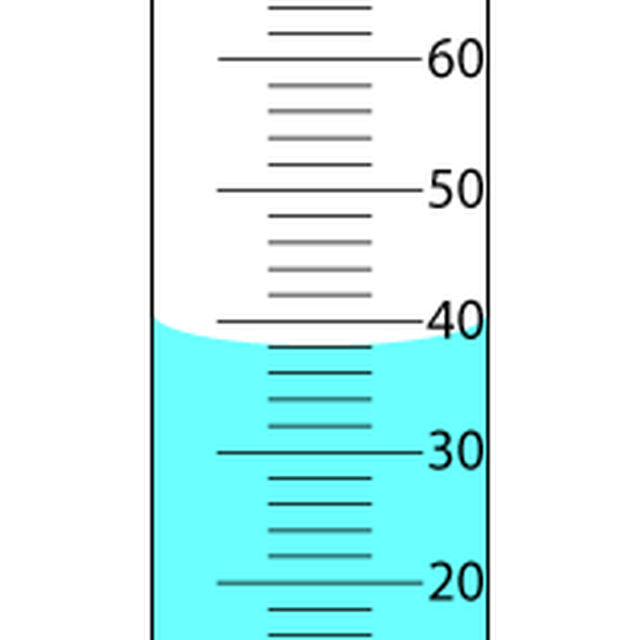
21.
Read the graduated cylinder
a)

760 mL

b)

7.6 mL

c)

76 mL

d)
78.0 mL
22.
How much liquid is in this graduated cylinder?
a)
30 mL
b)
30 cm
c)
30 Apples
d)
3,000 mL
23.
How long is this iPhone?
a)
11 Apples
b)
11 inches
c)
11 cm
d)
10.5 cm
24.
What units will you be using to measure this liquid?
a)

Millilitres

b)
Meters
c)
Apples
d)
Milimeters
25.
What protects the eyes from flying objects or chemical splashes?
a)
lab apron
b)
balance
c)
eye dropper
d)
goggles
26.
What protects the scientist and the scientist's clothes from hazardous or hot chemicals?
a)
goggles
b)
eye dropper
c)
ring clamp
d)
lab coat/apron
27.
Which is NOT a part of the metric system? 
a)
Inches
b)
Liters
c)
Grams
d)
Meters 
28.
What is the volume of the fish?
a)
18.0 cm3
b)
6.0 cm3 
c)
38.0 cm3
29.
What hazard is this sign warning you of?
a)
Explosive
b)
Corrosive 
c)
Acid
d)
Irritant
30.
When a bunsen burner is in safety mode, what colour should the flame be?
a)
Blue
b)
Yellow
31.
The things that are kept the same to ensure the results are due to the experiment is called..
a)
Control
b)
Constant
c)
Independent Variable
d)
Dependent Variable
32.
What is the INDEPENDENT  variable (cause) is this experiment? 
"Which type of medium is best for plant growth?" 
a)
height of plant (cm)
b)
type of medium (soil vs. sand)
c)
amount of medium
d)
types of plant
33.
What is the INDEPENDENT variable (cause)in this experiment?
"Which type of metal, copper or aluminum, conducts heat faster?" 
a)
size of metal
b)
types of metal
c)
time it takes to heat up
d)
shape of the metal
34.
An experiment is performed on plants to see how different liquids affect plant growth. Each plant in the experiment is given a different liquid; water, apple juice, or milk. Each plant has the same amount of soil, sunlight, and listens to the same music. In this investigation, the independent variable is ...
a)
The type of plant
b)
The amount of sunlight
c)
The type of music
d)
The type of liquid
35.

A student wonders if uniforms have an effect on grade averages. What is the independent variable in this situation?

a)

student grades

b)

uniforms

c)

class size

d)

age level

36.

What makes a good hypothesis?

a)

prior research

b)

"If...then" form

c)

it is testable

d)

all of the above

37.

Which tool(s) can be used to find volume?

a)

ruler

b)

beaker

c)

graduated cylinder

d)

triple beam balance

38.

What is the length?

a)

1.8 cm

b)

1.9 mm

c)

1.95 cm

d)

1.905 cm

39.

Which tool(s) are used to find mass?

a)

triple beam balance

b)

graduated cylinder

c)

digital scale

d)

microscope

40.

What is the scientific unit for volume?

a)

milliliters

b)

centimeters

c)

centigrams

d)

hectometers

41.

To strengthen a conclusion to a scientific investigation, a scientist could... (you may choose more than 1)

a)

repeat the experiment

b)

complete more trials

c)

have a different scientist follow their procedure (replication)

d)

change the materials in the experiment

42.

On the x-axis (horizontal) of a graph, we would expect to see...

a)

the dependent variable

b)

the independent variable

c)

the title of the graph

d)

controlled variables

43.

Which of the following is a detailed list of the steps in an experiment?

a)

conclusion

b)

operational definition

c)

procedure

44.

What is the SI base unit of mass?

a)

gram

b)

kilogram

c)

milligram

d)

pound

45.

Explaining on interpreting observations

a)

inferring

b)

predicting

c)

classifying

d)

investigating

46.

Comparing observations and data to reach a conclusion

a)

evaluating

b)

investigating

c)

predicting

d)

observing

47.

You should never ______ chemicals or materials used in lab.

a)

eat

b)

drink

c)

smell

d)

all of the above

48.
What is the independent variable in this graph?
a)
Hours worked
b)
Dollars earned
c)
Total income
d)
Dollars earned per hour
49.
Which example shows CORRELATION?
a)
I ate a hananero pepper and my mouth feels like it is on fire.
b)
Music lessons and brain development.
c)
I stepped on a spider and it died.
50.
What is a hypothesis?
a)
An observation
b)
A bar graph
c)
Facts
d)
A prediction of what will happen 
51.
Which step immediately follows the hypothesis in a scientific investigation?
a)
Create a graph
b)
Analyze data
c)
Share results
d)
Experiment
52.
The _________ is a set of specific steps that help scientists solve problems. 
a)
Design Process
b)
Scientific Method
c)
Dictionary
d)
Bar graph
53.

When using a graduated cylinder, look at the bottom of the ___________________ to find your measurement.

a)

scale

b)

liquid

c)

cylinder

d)

meniscus

54.

Which recorded measurement is correct?

a)

38 mL

b)

40.0 mL

c)

38.0 mL

d)

34.0 mL

55.

The variable that is changed in an experiment is the

a)

constant

b)

dependent variable

c)

control

d)

independent variable

56.

The variable that changes as a result of the experiment and is located on the Y axis of a graph is the

a)

Dependent Variable

b)

Hypothesis

c)

Independent Variable

d)

Control

57.
According to this graph, what is Earth's speed?
a)
10,000 m/s
b)
28,000 m/s
c)
33,000 m/s
d)
46,000 m/s
58.

What percentage of people chose pepperoni as their favorite type of pizza?

a)

10%

b)

33%

c)

50%

d)

67%

59.

Which month showed the biggest increase in total sales from the previous month?

a)

Febuary

b)

March

c)

April

d)

May

60.
What is this graph showing you?
a)
The worlds population is staying the same.
b)
The worlds population is going down (decreasing).
c)
The worlds population was growing but now is decreasing.
d)
The worlds population has been growing and will continue to grow. 
61.
How many variables can be tested in a controlled experiment?
a)
one
b)
two
c)
three
d)
as many as possible
62.

You need to take a survey at school to see which type of lunch food is most preferred by 7th grade students.


Which type of graph would be best to display the data?

a)

Line Graph

b)

Bar Graph or Pie Chart

c)

Scatter Plot

d)

Funnel Chart

63.

How many total people took part in the survey?

a)

50

b)

150

c)

100

d)

200

64.

What was the temperature of the liquid in the Styrofoam container at 4:00?

a)

55 degrees

b)

68 degrees

c)

73 degrees

d)

63 degrees

65.

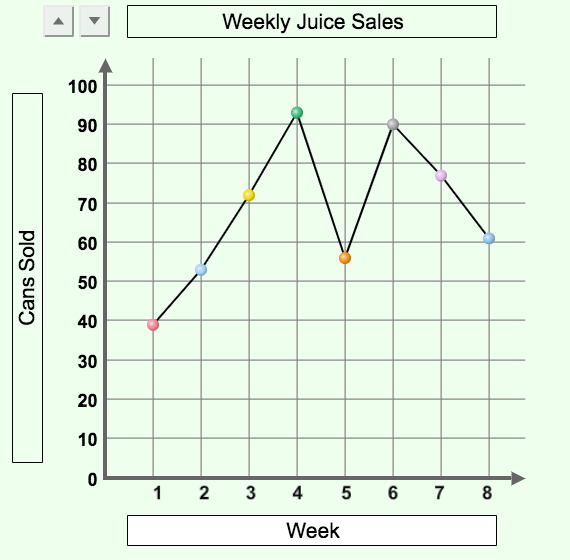
Identify the dependent variable by looking at the graph.

a)

Weeks

b)

Weekly Juice Data

c)

Cans Sold

d)

Indirect Relationship

66.

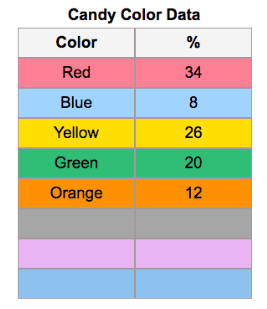
Based on the table provided, which type of graph would be best for the data?

a)

Line graph

b)

Bar Graph

c)

Pie Chart

d)

Scatter Plot

67.

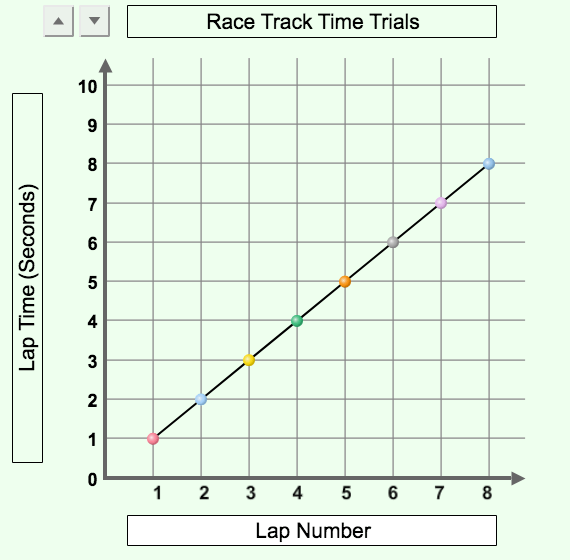
A car is timed around a race track for 8 laps. The laps are numbered in order. Look at the relationship between Lap Number and Lap Time (seconds).


What type of relationship is this?

a)

Direct

b)

Inverse

c)

Diagonal

d)

Horizontal

68.

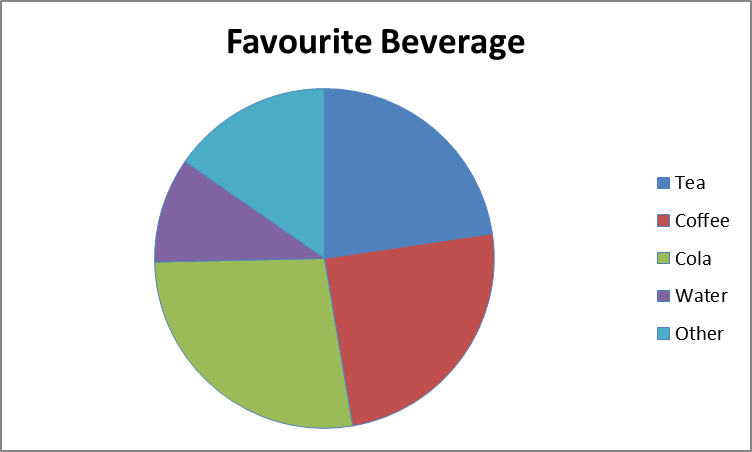
Approximately what percentage of people prefer Tea as their favorite beverage?

a)

around 28%

b)

around 18%

c)

around 25%

d)

around 23%

69.

You want to make a graph for an experiment you did about plant growth over a two week period of time. What type of graph would you use?

a)

Column graph

b)

Line graph

70.

What is are controlled variables?

a)

Anything that can affect the outcome of the experiment.

b)

The thing you change.

c)

The thing you test or measure.

d)

The things you keep the same.

71.

What type of graph is this?

a)

Column graph

b)
Line graph
72.
What do we put at the top of a graph?
a)

x-axis

b)

y-axis

c)

Title 

d)

Nothing

73.

What type of graph should be used for this data?

a)

Line graph

b)

Column graph

74.

Which graph has the X axis and Y axis labeled correctly?

a)

A

b)

B

c)

It depends on the data, either could be correct.

d)

Neither are correct.

75.
The purpose of graphs, charts and tables is to
a)
help scientists visualize results from an experiment.
b)
make the experiment look nice.
c)
practice what I learned in Math class.
d)
Practice my drawing skills.
76.

When carrying out an investigation in Science, you only change one thing - this will be what you are wanting to investigate. What do we call this variable?

a)

Independent Variable

b)

Dependent Variable

c)

Control Variable

77.

If we are investigating if the temperature of the water affects how long it takes sugar to dissolve, which 2 of the following would we need to keep the same to make it fair? (our control variables)

a)

The temperature of water

b)

The amount of sugar

c)

The amount of water

d)

The time taken

78.

After you have finished your investigation, you need to write a few sentences stating what your investigation shows. What is this called?

a)

A prediction

b)

An evaluation

c)

A conclusion

d)

A graph

79.

Before we start our investigation we can make a prediction and back it up with a scientific reason to explain why we think that. What is this called?

a)

A conclusion

b)

A thought

c)

A hypothesis

d)

A guess

80.

While carrying out our investigation, we record our results...

a)

in a graph

b)

in a table

c)

in our heads

d)

we don't need to record our results