
 Worksheets
🏃♂️Speed and Distance/Time Graphs🏃♂️
Total questions: 52
Worksheet time: 46mins
Mr. LaMarr ran 2 miles in 10 minutes, what is his speed?
0.2 miles/min
2 miles/min
20 miles/min
40 miles/min

The independent variable is also known as the
Manipulated Variable
Responding Variable
Controlled Variable
The dependent variable is also known as the
Manipulated Variable
Responding Variable
Controlled Variable
The constants, which remain unchanged, are also known as the
Manipulated Variable
Responding Variable
Controlled Variables


What type of relationship is shown in the graph?
Linear
Hyperbolic
Parabolic
No relationship
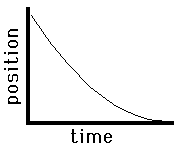
Describe the motion
Slow to fast; Negative direction
Fast to slow; Negative direction
Fast to slow; Positive direction
Slow to fast; Positive direction

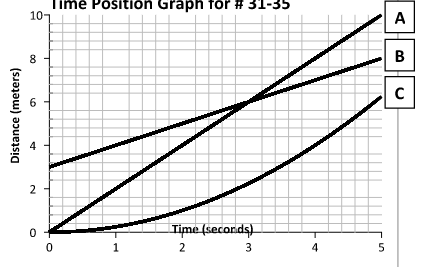
from 3rd second to 5th second, the object is
moving at a constant speed
speeding up
not moving
slowing down


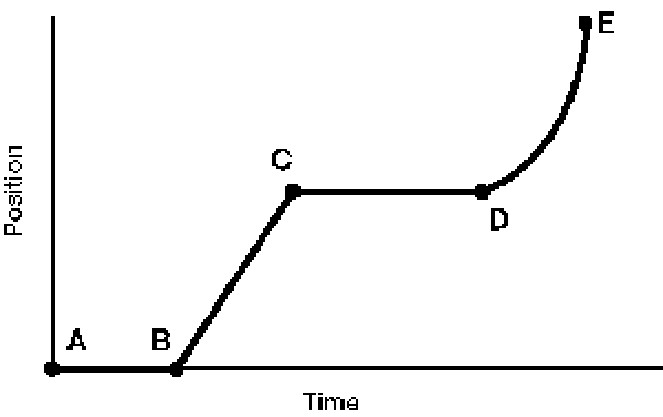
What is happening at E?
Stationary
Accelerating
Fast steady speed; moving away from the starting position
Steady speed; returning to start position
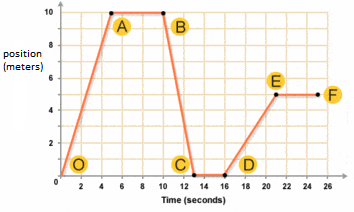
What is happening in this graph from point B to C?
The object is going down a hill.
The object is returning to its starting location.
The object is slowing down.
The object is staying still.
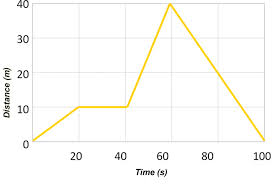
From t=1.0 second to t=3.0 seconds, the object is
moving at a constant speed
speeding up
not moving
slowing down
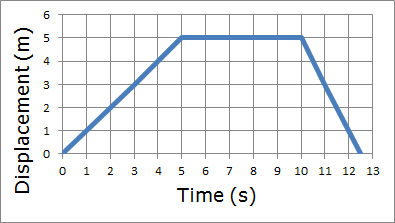
According to the graph how far does the person travel in the first 5 seconds?
2 m
10 m
0 m
5 m
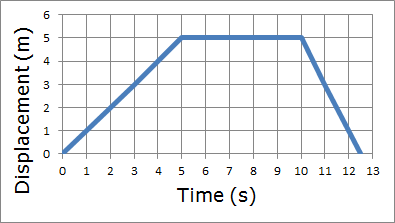
Which of the graphs shows that one of runners started 10 yards further ahead of the
other?


In which of the following graphs below are both runners moving at the same speed?


Match the description to the graph:
"The car is stopped."


Match the description to the graph:
"The car is traveling at a constant speed."
Match the description to the graph:
"The speed of the car is decreasing."
Match the description to the graph:
"The car is coming back."

Segment A-B The bus is _________________.
at rest
returning (to original position)
moving forward
Segment B-C The bus is _________________.
at rest
returning (to original position)
moving forward
Segment C-D The bus is _________________.
at rest
returning (to original position)
moving forward
Segment D-E The bus is _________________.
at rest
returning (to original position)
moving forward
Segment E-F The bus is _________________.
at rest
returning (to original position)
moving forward

Which runner won the race?
Albert
Bob
Charlie
Which runner stopped for a rest?
Albert
Bob
Charlie
How long did Charlie stop for a rest?
2.5 seconds
2 seconds
3 seconds
5 seconds
How long did Bob take to complete the race?
17 seconds
12 seconds
14 seconds
15 seconds
Calculate Albert's average speed for the 100-meter race.
8.33 m/s
5 m/s
7.14 m/s
5.88 m/s
Which of the graphs shows that one of runners started in the same place?
Which of the graphs shows that one of runners ended the race 10 yards ahead of the other?
In which of the following graphs below did one runner overtake (run past) the other?

