
NEW
Font size
S
M
L
XL
 Worksheets
Speed/Distance Graphs
Total questions: 37
Worksheet time: 36mins
Name
Class
Date
1.
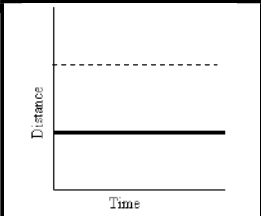
What does this graph represent?
a)
Constant speed
b)
Acceleration
c)
Not moving
2.

During which interval is the object speeding up?
a)
A to B
b)
B to C
c)
D to E
d)
E to F
3.

What is this graph showing?
a)
Constant Speed
b)
Acceleration (speeding up)
c)
Deceleration (slowing down)
d)
No motion
4.

The picture of the position vs. time graph shows an object that is...
a)
accelerating/speeding up
b)
moving at a constant speed
c)
not moving
d)
accelerating/slowing down.
5.

Ms. Pittman was walking at a constant pace to warm up for a run, but then stopped to tie her shoe. After tying her shoe she began running.
What distance/ time graph represents Ms. Pittman.
What distance/ time graph represents Ms. Pittman.
a)
A
b)
B
c)
C
d)
D
6.

Which graph represents a students standing at their locker for a period of time.
a)
A
b)
B
c)
C
d)
D
7.

Which graph represents a students standing at their locker for a period of time.
a)
A
b)
B
c)
C
d)
D
8.

Ms. Pittman went to the movies. She drove at a constant speed the whole way there, and after the movie was over she drove back home at the same constant speed.
What graph is represented by Ms. Pittman's journey?
What graph is represented by Ms. Pittman's journey?
a)
Top Left
b)
Top Right
c)
Bottom Left
d)
Bottom Right
9.

Who is traveling at the slowest speed? (click the words to view the picture)
a)
Finn
b)
Marceline
c)
Jake
d)
All are traveling the same speed
10.

Erick and Emily graphed the motion of a rolling marble in a maze. Use the graph attached and choose the BEST answer that explains motion of the marble between point A and point B on the graph. The marble moved:
a)
at a rate of 5 meters per second.
b)
at a rate of 1 meter per second.
c)
steadily and accelerated for 5 seconds.
d)
gradually and slowed down for 5 seconds.
11.

Use the graph and choose the BEST answer that explains the forces acting on the marble between point A and point B. The forces acting on the marble:
a)
push the marble
b)
pull the marble using gravity
c)
were balanced
d)
were unbalanced
12.

Use the graph and choose the answer that describes the motion of the marble between point D and point E.
a)
The marble continued at a constant speed.
b)
The marble slowed down.
c)
The marble stopped.
d)
The marble was pulled to the ground by gravity.
13.

Use the graph and choose the answer that describes what happened to the marble at point B.
a)
An unbalanced force made the marble slow down.
b)
Unbalanced force made the marble change direction.
c)
The forces of friction and gravity made the marble slow down.
d)
A balanced force made the marble change direction and slow downn.
14.

Molly is watching a wind-up toy walking across a table. She observes that the toy covers 1 cm every second for 10 seconds. Which graph do you think most closely represents the toy's journey across the table?
a)
A
b)
B
c)
C
d)
D
15.

Every morning John walks a half mile to school. One Morning, halfway to school, he stopped to watch a some deer in the field. When he realized he was late, he ran the rest of the way to school to avoid being late. Which graph below shows John's speed during his walk to school?
a)
A
b)
B
c)
C
d)
D
16.

Alesia is taking an all day ride on her bicycle. The graph shows how far she is from home at different times during her ride. During which time period is Alesia moving fastest?
a)
0–1 hours
b)
3–4 hours
c)
4–5 hours
d)
6–7 hours
17.

The graph shows the motion of four cars. All four cars are moving east.
Which car has a constant velocity?
Which car has a constant velocity?
a)
1
b)
2
c)
3
d)
4
18.

A helicopter ambulance flew from one hospital to another in a straight line. The pilot had to change speed several times due to the presence of other aircraft.
What was the average speed of the helicopter during the trip?
What was the average speed of the helicopter during the trip?
a)
2.0 km/min
b)
2.5 km/min
c)
4.0 km/min
d)
7.5 km/min
19.

What is happening in this graph from point A to B?
a)
The object is accelerating.
b)
The object is not moving.
c)
The object is decelerating.
d)
The object is moving at a constant speed.
20.

What is happening in this graph from point B to C?
a)
The object is going down a hill.
b)
The object is returning to its starting location.
c)
The object is slowing down.
d)
The object is staying still.
21.

What does this graph represent?
a)
Constant speed
b)
Acceleration
c)
Not moving
22.

What does this graph represent?
a)
Constant Speed
b)
Acceleration
c)
Not moving
23.
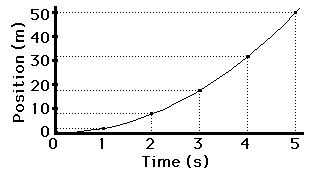
The picture of the position vs. time graph shows an object that is...
a)
accelerating/speeding up
b)
moving at a constant speed
c)
not moving
d)
accelerating/slowing down.
24.

What does this graph represent?
a)
Constant Speed
b)
Acceleration
c)
Not moving
25.

What is happening at D?
a)
Stationary
b)
Accelerating
c)
Fast steady speed; moving away from the starting position
d)
Slower steady speed; moving away from the starting position
26.

What is happening at E?
a)
Stationary
b)
Accelerating
c)
Fast steady speed; moving away from the starting position
d)
Steady speed; returning to start position
27.

What is happening at A?
a)
Stationary
b)
Accelerating
c)
Slower steady speed; moving away from the starting position
d)
Steady speed; returning to start position
28.

Which runner won the race?
a)
A
b)
B
c)
C
d)
It was a tie
29.

Which runner had a head start?
a)
A
b)
B
c)
C
d)
None of them
30.
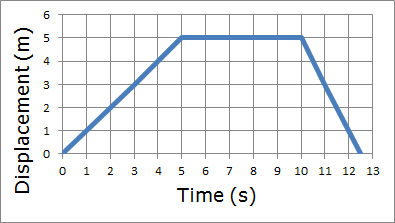
According to the graph how far does the person travel in the first 5 seconds?
a)
2 m
b)
10 m
c)
0 m
d)
5 m
31.
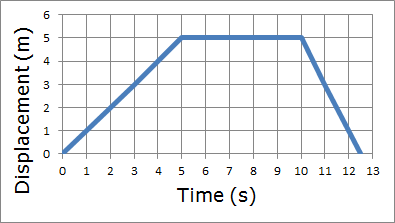
What is the person doing from 5 seconds to 10 seconds?
a)
Walking
b)
Running
c)
Standing Still
d)
Walking Fast
32.

What is the average speed of the person during the first 5 seconds?
a)
0 m/s
b)
1 m/s
c)
3 m/s
d)
6 m/s
33.

Which object had the greatest average speed?
a)
A
b)
B
c)
C
d)
D
34.

What is happening between points Q and R?
a)
running at a constant speed
b)
running at an increasing speed
c)
running in place at a constant speed
d)
running back toward the starting position
35.

What is happening to the car's motion?
a)
It did not travel at a constant speed for the entire trip
b)
the total time for the car trip was 50 minutes
c)
It did not slow down during the trip
d)
It returned to where it had started the trip at the end of the trip
36.

The graph shows the motion of a cart. When is the cart moving forward at a constant speed?
a)
AB
b)
DE
c)
CD
d)
BC
37.

Which of the following statements is correct?
a)
The horse accelerated, then decelerated
b)
The horse did not accelerate
c)
The horse accelerated constantly
d)
The horse's speed was constant
Reset

