wayground logo

Free Printable Worksheets

NEW

Font size

S
M
L
XL
Worksheets

Representing Motion (Test Review)

Total questions: 55

Worksheet time: 3575secs

Name
Class
Date
1.
In a coordinate system, the _____ is the point at which both variables have the value of zero.
a)
distance
b)
magnitude
c)
origin
d)
vector
2.
What is plotted on the horizontal axis of a position-time graph?
a)
motion
b)
position 
c)
speed 
d)
time
3.
During which interval is the object not moving?
a)
B to C
b)
C to D
c)
D to E
d)
only at point A
4.
During which interval is the object traveling at a constant velocity?
a)
B to C
b)
D to E
c)
F to G
d)
it traveling at a constant velocity during all of the intervals shown.
5.
During which interval is the object speeding up?
a)
A to B
b)
B to C
c)
D to E
d)
E to F
6.
During which interval is the object slowing down?
a)
A to B
b)
D to E
c)
E to F
d)
G to H
7.
What is happening at B?
a)
Stationary
b)
Accelerating
c)
Slower steady speed; moving away from the starting position
d)
Steady speed; returning to start position
8.
What is happening at A?
a)
Stationary
b)
Accelerating
c)
Slower steady speed; moving away from the starting position
d)
Steady speed; returning to start position
9.
What is happening at E?
a)
Stationary
b)
Accelerating
c)
Fast steady speed; moving away from the starting position
d)
Steady speed; returning to start position
10.
Which graph shows the object standing still?
a)
A
b)
B
c)
C
d)
D
11.
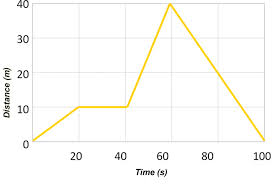
How long did it take this object to travel back to its reference/starting point?
a)
20 s
b)
30 s
c)
60 s
d)
100 s
12.
What does this graph represent?
a)
Constant speed
b)
Acceleration
c)
Not moving
13.
Which runner won the race?
a)
A
b)
B
c)
C
14.
Which runner had a head start?
a)
A
b)
B
c)
C
15.
At what time did runner A pass runner B?
a)
0 seconds
b)
1 second
c)
2 seconds
d)
3 seconds
16.
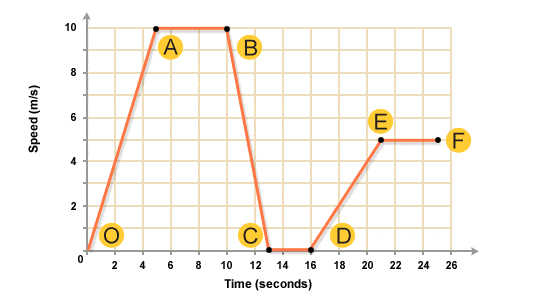
What is happening in this graph from point B to C?
a)
The object is going down a hill.
b)
The object is returning to its starting location.
c)
The object is slowing down.
d)
The object is staying still.
17.
What is happening in the graph from point O to A?
a)
The object is moving SLOWLY
b)
The object is moving FAST
c)
The object is NOT moving
d)
The object is accelerating
18.
What is happening in this graph from point A to B?
a)
The object is accelerating.
b)
The object is not moving.
c)
The object is decelerating.
d)
The object is moving at a constant speed.
19.
How many times does this object STOP moving?
a)
None
b)
Once
c)
Twice
d)
Three times
20.
The location of a place or an object is called its....
a)
position
b)
motion
c)
speed
d)
reference point
21.
A location to which you can compare other locations is called
a)
reference point
b)
motion
c)
location
d)
position
22.
True or False:
The motion of an object can change over the course of its movement
a)
true
b)
false
23.
The measure of how quickly something moves or the distance it moves in a given amount of time is called
a)
motion
b)
position
c)
speed
d)
location
24.
Speed is equal to the distance divided by
a)
position
b)
time
c)
height
d)
motion
25.
The unit speed is measured in is
a)
m/s
b)
ft/min
c)
m/hr
d)
m/s^2
26.
A wheelchair racer completes a 100 meter course in 20 seconds. What is his speed?
d= 100 m
t= 20 s
a)
10 m/s
b)
5 m/s
c)
2 m/s
d)
0 m/s
27.
Carlos lives 100 meters from his friend's house. What is his average speed if he reaches his friends house in 50 seconds?
Distance= 100 m
time = 50 seconds
a)
1 m/s
b)
2 m/s
c)
3 m/s
d)
4 m/s
28.
In a distance time graph, the steeper the line the...
a)
greater the speed
b)
slower the speed
c)
speed has reached zero
d)
speed has not changed
29.
Speed in a specific direction is called
a)
speed
b)
acceleration
c)
position
d)
velocity
30.
Acceleration is
a)
increasing speed
b)
decreasing speed
c)
changing direction
d)
all of the above
31.

Which of the graphs shows that one of runners started 10 yards further ahead of the

other?

a)
b)
c)
d)
32.

In which of the following graphs below are both runners moving at the same speed?

a)
b)
c)
d)
33.

Match the description to the graph:

"The car is stopped."

a)
b)
c)
d)
34.
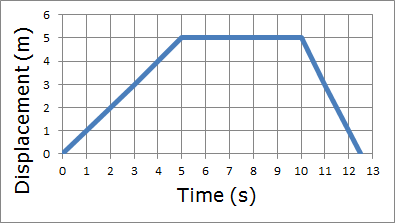
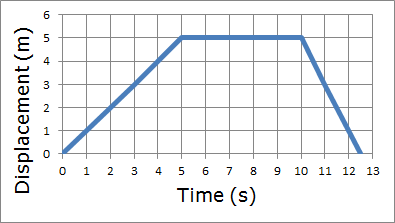
According to the graph how far does the person travel in the first 5 seconds?
a)
2 m
b)
10 m
c)
0 m
d)
5 m
35.
What is the person doing from 5 seconds to 10 seconds?
a)
Walking 
b)
Running
c)
Standing Still 
d)
Walking Fast
36.
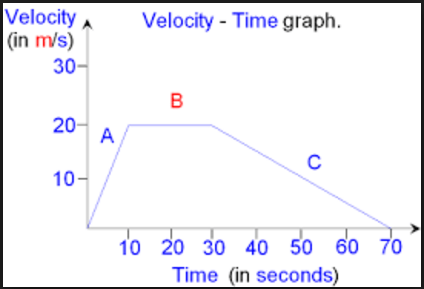
This is a velocity-time graph.  What is the object doing in segment B?
a)
Positive acceleration
b)
Negative acceleration
c)
Constant Velocity
d)
Not moving
37.
What kind of acceleration is shown here?
a)
positive
b)
negative
c)
none
d)
varies
38.
What is velocity?
a)
the quickness of an object
b)
the location of an object
c)
acceleration
d)
speed in a specific direction
39.
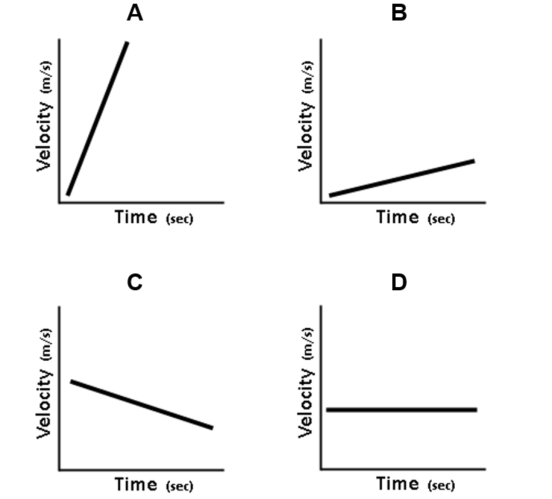
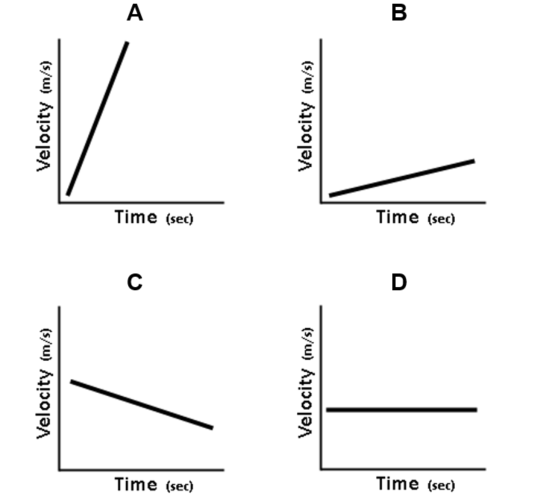
Which graph represents the greatest acceleration?
a)
A
b)
B
c)
C
d)
D
40.
What kind of acceleration is shown here?
a)
positive
b)
negative
c)
none
d)
varies
41.
What is the velocity?
a)
positive
b)
negative
c)
decreasing
d)
increasing
42.
Which section of the graph shows deceleration?
a)
AB
b)
BC
c)
EF
d)
GH
43.
Which graph represents zero acceleration (constant velocity)?
a)
A
b)
B
c)
C
d)
D
44.
What is happening in this graph from point B to C?
a)
The object is going down a hill.
b)
The object is returning to its starting location.
c)
The object is slowing down.
d)
The object is staying still.
45.

What is the speed of segment A?

a)

0.5 m/s

b)

2 m/s

c)

3 m/s

d)

0 m/s

46.

What is the speed of segment C?

a)

0.5 m/s

b)

2 m/s

c)

3 m/s

d)

0 m/s

47.

What is the speed of segment B?

a)

0.5 m/s

b)

2 m/s

c)

3 m/s

d)

0 m/s

48.

What is the speed of segment D?

a)

0.5 m/s

b)

2 m/s

c)

3 m/s

d)

0 m/s

49.

What is the total distance traveled?

a)

20 m

b)

30 m

c)

40 m

d)

50 m

50.

What is the total time traveled?

a)

20 s

b)

30 s

c)

40 s

d)

50 s

51.

Juan goes for a run. After running for 20 minutes,

he takes a 5­ minute break. Which graph best represents this?

a)
b)
c)
d)
52.

Which graph best illustrates a ball that comes to a complete stop?

a)
b)
c)
d)
53.

Joe rolls a ball to Cindy, and Cindy rolls it back to Joe at the same speed.

Which graph shows the motion of the ball as it rolls between them?

a)
b)
c)
d)
54.

Which graph depicts an object whose speed is increasing?

a)
b)
c)
d)
55.

Which graph best illustrates a train sitting at the station waiting to depart?

a)
b)
c)
d)