wayground logo

Free Printable Worksheets

Font size

S
M
L
XL
Worksheets

4.12 Data and Stats Review

Total questions: 152

Worksheet time: 5hrs 37mins

Name
Class
Date
1.
Find the mean of these numbers:
5, 11, 2, 12, 4, 2
a)
4.1
b)
6
c)
36
d)
4
2.
Find the median of these numbers:
4, 2, 7, 4, 3
a)
2
b)
5
c)
7
d)
4
3.
Find the median, mode and range: 
3, 5, 7, 9, 11, 8, 3
a)
median:7  mode:11  range:8
b)
median:6  mode:3  range:7
c)
median:7  mode:3 range:8
4.
Identify the outlier for the given data?
23, 34, 27, 7, 30, 26, 28, 31, 34
a)
7
b)
23
c)
31
d)
34
5.
The mean is
a)
The middle score
b)
 The sum of the numbers divided by the number of data
c)
The most frequent score
d)
The middle when in order
6.
What is a the meaning for "median"?
a)
fair share
b)
middle
c)
repeats the most
d)
variation
7.
Calculate the range of the following:
2, 5, 8, 3, 13, 5
a)
11
b)
13
c)
5
d)
8
8.
Calculate the interquartile range of the following data:
17, 18, 18, 19, 20, 21, 21, 23, 25
a)
3
b)
4
c)
5
d)
8
9.
Which number is not the mean, median, mode, or range of the data set 4, 3, 15, 11, 3, 8, 7, 5?
a)
3
b)
6
c)
12
d)
11
10.
What is the mode?
a)
# happening the most
b)
the average
c)
biggest - smallest
d)
the middle #
11.
If there is an even number of data in the data set how do you find the median?
a)
order the data and find the middle value
b)
order the data add the 2 middle values and divide by 2
12.
The mode score on the 6th grade math test was 94! Which of these interpretations must be correct?
a)
99 was the highest score on the test.
b)
More students received a 94 than any other score
c)
No student scored below a 50
d)
A score of 91 was slightly below average.
13.
When calculating the mean you
a)
add all the numbers together and divide by the number of items
b)
scream
c)
cry 
d)
pick the one that happens the most
14.
I have been walking to keep fit. These are the number of miles I have been walking everyday: 5, 4, 3, 5, 4.5, 5.5 and 2.5. What is my mean walking distance?
a)
3.5
b)
4.75
c)
4.21
d)
3.71
15.
A data set can have more than one mode
a)
True
b)
False
16.
In order to find the median, the data must be sorted from least to greatest first.
a)
True
b)
False
17.

Task Card No. 1


The list shows the area in square feet of each apartment available for rent in a building.


565, 961, 867, 517, 627, 714, 517, 728


What is the range of these areas in square feet?

a)

163

b)

517

c)

444

d)

714

18.

Task Card No. 2


Jacqueline's math daily grades for the 3rd nine weeks are shown in the table.


What is the median of Jacqueline's daily grades?

a)

82.5

b)

90

c)

25

19.

Task Card No. 3


Garcia Middle School collected data on the number of students absent for two weeks. Their results are recorded below.


What is the mode of the data?

a)

6

b)

13

c)

-10

d)

10

20.

Task Card No. 4


Which statement is true about the following data set?


15, 16, 18, 25, 16

a)

The range is 1

b)

The mean is 18

c)

The median is 18

d)

There is no mode

21.

Task Card No. 5


Jayden counted the number of candy pieces in 15 fun-sized bags. His results are recorded below


12 14 14 13 13

11 11 13 15 14

13 12 12 13 14


What is the median of the data?

a)

15

b)

14

c)

13

d)

12

22.

Task Card No. 6


Leslie counted the number of miles she ran each day for two weeks. Her results are recorded below.


3 7 7 1 3 3 1

7 2 1 6 1 4 5


What is the mode of the data?

a)

3

b)

7

c)

1

23.

Task Card No. 8


The list shows the number of pages each book in a series.


183, 214, 193, 174


What is the mean number of pages?

a)

119

b)

49

c)

191

24.

Task Card No. 7


Daymesha counted the number of Taki's she ate in one week. Her results are recorded below


473 253 198 467 543 247 124


What is the range of the data?

a)

349

b)

27

c)

467

d)

419

25.

Task Card No. 11


What is the mean number of texts sarah received each day during the 10-day period?

a)

39

b)

37

c)

32

d)

40

26.

Task Card No. 12


What is the range for the data in the table?

a)

22

b)

29

c)

41

d)

19

27.

Task Card No. 15


Which statement is NOT true about the following data set?


10, 11, 12, 12, 14, 12, 15, 10

a)

The mean is 12

b)

The median is 12

c)

The mode is 12

d)

The range is 12

28.

Which set of data has the greatest range?

a)

25, 23, 28, 25, 30

b)

0, 9, 18, 6, 4

c)

101, 102, 103, 104, 105

d)

50, 52, 58, 58, 60

29.
What is an outlier?
a)
A value that is much less or much greater than the other values in a data set.
b)
The difference between the upper and lower quartiles of a data set.
c)
The mean of the distances from each data value in a set to the mean of a set.
d)
The difference between the greatest and least numbers in a data set.
30.
Kayte took a sample of 50 pieces of data.  She added up all of the pieces of data and then divided by 50.  What measure of center is she working on?
a)
Mean
b)
Median
c)
Mode
d)
Range
31.
A set of data is given: 3, 7, 11, 11, 16
Jesse calculated a measure of central tendency and got 9.6, which measure of central tendency did he just calculate?
a)
Mean
b)
Median
c)
Mode
d)
Range
32.
Which set of data has a higher mean?
BOB:  1.3, 3.1, 4.1, 2.5, 2.2,  2.8
MEGAN: 5.5, 1.1, 1.2, 2.4, 3.8, 2.0, 1.9
a)
BOB > MEGAN
b)
BOB < MEGAN
c)
BOB=MEGAN
33.
If you have two numbers in the middle, you should
a)
add them together and divide by two
b)
find the number in between the two
c)
find the mean of the two numbers
d)
all of these
34.
The mode score on the 9th grade math test was 94! Which of these interpretations must be correct?
a)
99 was the highest score on the test.
b)
More students received a 94 than any other score
c)
No student scored below a 50
d)
A score of 91 was slightly below average.
35.
Your math grades are 90, 85, 58, 90, 80, 100, and 90.  Which grade is the outlier?
a)
90
b)
58
36.
What is the range of the set of data?
a)
70
b)
65
c)
80
d)
55
37.
The number of cookies that were made at a bakery for each of seven days is shown:
108, 96, 96, 84, 108, 240, and 84
The best measure of center for this data set is the-
a)
median because 240 is much higher than the other numbers in the data set
b)
median because all of the values are close to one another in value 
c)
mean because 240 is much higher than the other numbers in the data set 
d)
mean because all of the values are close to one another in value
38.
In which of the following situations would the mean be an appropriate measure of central tendency?
I. when the data set contains no outliers
II. when using categorical data
III. when an exact average is needed
IV. when the middle value is needed 
a)
II and III only
b)
I and III only 
c)
I, III, and IV only
d)
All of the above
39.
Roger tried to fill up fifteen bottles of water with the same amount of water. The amounts of water in the bottles were measured in ounces.
15.4, 15.5, 16.5, 14.6, 16.2, 14.3, 14.8, 16.6, 15.3, 14.7, 16.9, 17.2, 15, 15.7, 15.8
Which would be the best measure of center for these amounts of water? 
a)
range
b)
median
c)
mode
d)
mean
40.
Which city is the most popular?
a)
Bently
b)
Greatville
c)
Rivertop
d)
Friendship
41.
Which city is the least popular?
a)
Bently
b)
Greatville
c)
Rivertop
d)
Friendship
42.
About what percent of the people live in Friendship? (Rounded to the nearest whole number)
a)
46%
b)
100%
c)
25%
d)
34%
43.
About what percent of the people live in Bently?
a)
82%
b)
41%
c)
29%
d)
23%
44.
What is the difference in population between Friendship and Rivertop?
a)
3,000
b)
300
c)
30
d)
3
45.
Which city has the second highest population?
a)
Bently
b)
Greatville
c)
Rivertop
d)
Friendship
46.
About what percent of the population live in the least popular town?
a)
2%
b)
18%
c)
41%
d)
22%
47.
How many more people liked blueberries than kiwi and bananas?
a)
40 more people like blueberries than kiwi and bananas.
b)
30 more people like blueberries than kiwi and bananas.
c)
15 more people like blueberries than kiwi and bananas.
d)
5 more people like blueberries than kiwi and bananas.
48.

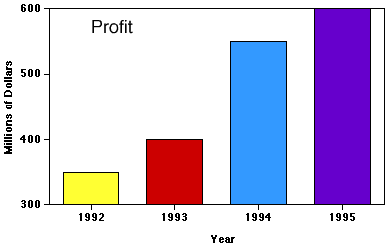
What is the best summary statement for this graph?

a)

Profits decreased in later years.

b)

Profits remained the same through the years.

c)

Profits increased through the years

49.
How many students take the bus to school?
a)
35
b)
20
c)
10
d)
15
50.
How many total people took the survey?
a)
50
b)
150
c)
100
d)
200
51.

How many BMX bikes were sold?

a)

22

b)

28

c)

17

d)

6

52.

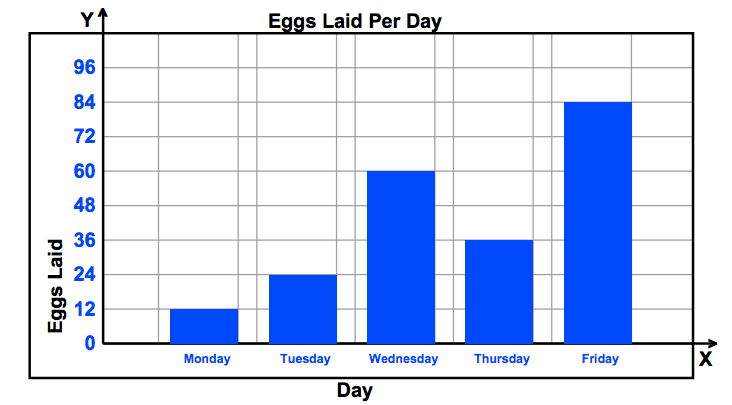
How many more eggs were laid on Friday than Wednesday?

a)

84

b)

36

c)

24

d)

60

53.

Did the number of eggs laid increase or decrease between Monday and Tuesday?

a)

increase

b)

decrease

54.

How many more runs did Doug have than Sarah?

a)

6

b)

4

c)

5

d)

8

55.
How many more students like soccer than basketball?
a)
24
b)
15
c)
10
d)
17
56.
How many students like vanilla and chocolate?
a)
8
b)
32
c)
30
d)
28
57.
How many more students like soccer than basketball?
a)
24
b)
15
c)
10
d)
17
58.

Look at the bar graph, "Nicest Fruit". What does the x-axis show?

a)

Types of fruit

b)

The number of people.

59.

Look at the bar graph, "Nicest Fruit". What does the y-axis show?

a)

Types of fruit

b)

Number of people.

60.

Look at the bar graph, "Nicest Fruit". What scale does the bar graph use?

a)

1

b)

2

c)

5

d)

10

61.

Look at the Bar Graph "Student Grades". Which grade did the smallest number of students get?

a)

A

b)

B

c)

C

d)

D

62.
How many more chickens are there than goats on Hackberry farm?
a)
12
b)
11
c)
10
d)
13
63.

What is the spread in gas mileage for SUVs?

a)

2

b)

3

c)

4

d)

6

64.

Are these dot plots symmetric?

a)

Yes

b)

No

c)

The SUV graph is, but the Cars graph isn't

65.

What is the center gas mileage for the Cars graph?

a)

24

b)

25

c)

25.5

66.

Is the SUV dot plot clustered to the left or right?

a)

left

b)

right

67.

Where is the peak in the data?

a)

97%

b)

100%

c)

13

d)

89%

68.

What shape is the data shown in the dot plot?

a)

symmetrical

b)

clustered to the left

c)

clustered to the right

69.
What is the range of the data shown?
a)
85
b)
90
c)
80
d)
70
70.

Which statement correctly describes the shapes of the dot plots for cars and SUVs?

a)

SUVs: symmetrical

Cars: clustered left

b)

Both are clustered left

c)

Both are symmetrical

d)

SUVs: clustered to the left

Cars: clustered to the right

71.

Which statement best describes the data shown in the dot plot?

a)

The peak of the data is at 35

b)

The data are clustered from 30 to 32

c)

The data distribution has gaps

d)

The data distribution is symmetrical

72.
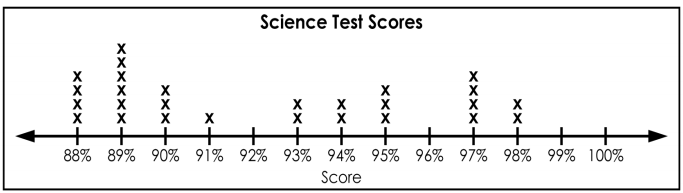
How many students received a score of 94%? 
a)
94
b)
4
c)
1
d)
2
73.
What is the highest score in the class?
a)
88%
b)
100%
c)
13
d)
98%
74.
How many students received a score in the 80's?
a)
2
b)
10
c)
14
d)
27
75.

How many students scored 93% or less?

a)

6

b)

16

c)

14

d)

13

76.
How many total students are in the science class?
a)
13
b)
6
c)
27
d)
25
77.
What is the difference between the highest score and the lowest score on the test?
a)
15
b)
100
c)
6
d)
10
78.
How many more students scored a 88 than scored a 98?
a)
4
b)
2
c)
6
d)
35
79.
How many students scored between 95 and 100?
a)
6
b)
6
c)
9
d)
14
80.

What is the range of the data?

a)

105

b)

110 and 101

c)

9

d)

7

81.

What is the median of the data?

a)

105

b)

106

c)

104

d)

110

82.
Are there any outliers in the data?
a)
Yes
b)
No
83.
What is the difference in the median gas mileage?
a)
0
b)
5
c)
7
84.
The mean is
a)
The middle score
b)
 Total & divided by number of scores
c)
The most frequent score
d)
The middle when in order
85.
The median is
a)
The middle score
b)
 Scores added & divided by the number of scores
c)
The most frequent score
d)
The middle when in order
86.

Compare the spread of the two dot plots.

a)

The range are the same.

b)

The range of video games is less than exercise by 2.

c)

The range of exercise is greater than video games by 2.

d)

The range of exercise is less than video games by 2.

87.

How many people had AT MOST 2 drinks?

a)

4

b)

6

c)

5

d)

2

88.

Which snack option received the least amount of votes?

a)

Kit Kats

b)

Pretzels

c)

Twizzler

d)

Popcorn

89.

How many people chose either Twizzlers or Pretzels?

a)

4

b)

6

c)

8

d)

10

90.

Compare the center of the two dot plots.

a)

The median of boys is larger than girls

b)

The medians are the same.

c)

The median of girls is greater than boys.

d)

The medians do not exist.

91.
The team scored 80 points. How many points did Porter score?
a)
40 points
b)
32 points
c)
14.4 points
d)
12 points
92.
There are 200 vegetable plants in a garden.  How many of the vegetable plants are green beans?
a)
16
b)
24
c)
28
d)
32
93.
What is the range of the data?
a)
4
b)
8
c)
6
d)
2
94.
How many more students played soccer than football?
a)
3
b)
30
c)
6
d)
60
95.
Students were surveyed about their favorite sports to play in phys.ed. The results are represented in this circle graph. If 48 students were surveyed, how many chose soccer?
a)
10
b)
12
c)
15
d)
14
96.
If there are 300 seventh graders, how many students prefer choir?
a)
96
b)
24
c)
75
d)
42
97.
According to this graph, for every 24 hours, about how many hours are spent watching TV?
a)
0 hours
b)
5 hours
c)
13 hours
d)
3 hours
98.
The team scored 50 points. How many points did Kendrick score?
a)
12 points
b)
20 points
c)
10 points
d)
72 points
99.
330 sixth grade students at ABMS were asked what their favorite sport is. How many said Baseball is their favorite sport?
a)
6.6
b)
82.5
c)
99
d)
66
100.
330 sixth grade students at ABMS were asked what their favorite sport is. How many students said that Gymnastics is their favorite sport?
a)
16.5
b)
165
c)
180
d)
45
101.
120 students were surveyed about their favorite sport. What two sports could represent 60 students?
a)
Baseball and Track
b)
Soccer and Basketball
c)
Track and Basketball
d)
Soccer and Track
102.

How many students take the bus to school?

a)

35

b)

20

c)

10

d)

15

103.
How many more Rose flowers are there than Lily?
a)
3
b)
4
c)
9
104.
How many more Tulips than Rose flowers?
a)
2
b)
3
c)
6
d)
11
105.

Based on the graph, how many more students are in the science club than the book club?

a)

20

b)

16

c)

46

d)

18

106.
How many more people have purple for a favorite color than red?
a)
3
b)
5
c)
7
d)
9
107.
How many students have blue for a favorite color?
a)
11
b)
12
c)
14
d)
17
108.
The team scored 50 points. How many points did Kendrick score?
a)
12 points
b)
20 points
c)
10 points
d)
72 points
109.
There are 200 vegetable plants in a garden.  How many of the vegetable plants are green beans?
a)
16
b)
24
c)
28
d)
32
110.
600 people were surveyed. How many people rode the stationary bikes that day?
a)
150 people
b)
120 people
c)
90 people
d)
None of these
111.
Approximately how many more hours a day are spent sleeping than eating?
a)
8 hours
b)
6 hours
c)
2 hours
d)
12 hours
112.
Approximately how many hours a day are spent in school and doing homework?
a)
6 hours
b)
8 hours
c)
2 hours
d)
12 hours
113.

The circle graph shown shows the results of a survey about favorite pizza toppings for people living in the United States. If this survey included 2,500 people, how many people said cheese is their favorite topping?

a)

100 people

b)

625 people

c)

10,000 people

d)

1,250 people

114.
There are 200 plants in a garden.  How many of the plants are either cucumbers or peppers?
a)
9
b)
11
c)
32
d)
40
115.
How many total people took the survey?
a)
50
b)
150
c)
100
d)
200
116.
200 people were surveyed about their favorite ice cream. How many chose Kesar Pista? 
a)
30 people
b)
60 people
c)
38 people
d)
None of these
117.
Approximately, how much time does a student spend socializing during a calendar  week? (What is the difference between the hours in a week and the hours in a day?)    
a)
3 hours
b)
24 hours
c)
21 hours
d)
14 hours
118.
Which of the following lists all parts of the five number summary?
a)
Mean, Median, Mode, Range, and Total
b)
Minimum, Quartile 1, Median, Quartile 3, and Maximum 
c)
Smallest, Q1, Q2, Q3, and Q4
d)
Minimum, Maximum, Range, Mean, and Median
119.
What is the median of the data?
a)
200
b)
100
c)
90
d)
140
120.
What is the range of the set of data?
a)
70
b)
65
c)
80
d)
55
121.
What value is the lower quartile (Q1)?
a)
66
b)
58
c)
60
d)
64
122.
What is the maximum value?
a)
58
b)
66
c)
64
d)
60
123.
What data value is the upper quartile (Q3)?
a)
64
b)
62
c)
66
d)
58
124.
What is the minimum value?
a)
64
b)
58
c)
66
d)
61
125.
What is the interquartile range (IQR)?
a)
4
b)
64
c)
60
d)
8
126.
Which restaurant has a higher median wait time?
a)
Lucy's Steakhouse
b)
Gary's Grill
c)
They are the same
127.

What percent of students have a height between 58 inches and 60 inches?

a)

25%

b)

50%

c)

75%

d)

100%

128.
What is the minimum value?
a)
64
b)
58
c)
66
d)
60
129.
What is the maximum value?
a)
58
b)
66
c)
64
d)
60
130.
What data value is the upper quartile (Q3)?
a)
64
b)
62
c)
66
d)
58
131.
What value is the lower quartile?
a)
66
b)
58
c)
60
d)
64
132.
What is the median?
a)
62
b)
58
c)
66
d)
60
133.
What is the interquartile range (IQR)?
a)
4
b)
64
c)
60
d)
8
134.
Which box and whisker plot has the highest median?
a)
Top plot
b)
Bottom plot
135.
What is the median of the data?
a)
200
b)
100
c)
90
d)
140
136.
What is the median of the data?
a)
200
b)
100
c)
90
d)
140
137.
What is the interquartile range?
a)
4
b)
6
c)
2
d)
8
138.
Which car club has the higher median?
a)
Cruisers
b)
Car Hops
139.
What data value is the upper quartile?
a)
64
b)
62
c)
66
d)
58
140.
What is the interquartile range (IQR) of the data set?
a)
20
b)
25
c)
5
d)
10
141.
What is the maximum value?
a)
58
b)
66
c)
64
d)
60
142.
What is the median of the data?
a)
200
b)
100
c)
90
d)
140
143.
What is the range of the set of data?
a)
70
b)
65
c)
80
d)
55
144.
What value is the first quartile (Q1)?
a)
66
b)
58
c)
60
d)
64
145.
What data value is the third quartile (Q3)?
a)
64
b)
62
c)
66
d)
58
146.
What is the minimum value?
a)
64
b)
58
c)
66
d)
61
147.
What percent of students have a height between 58 inches and 60 inches?
a)
25%
b)
50%
c)
75%
d)
100%
148.
Which car club has the higher median?
a)
Cruisers
b)
Car Hops
149.
Find the interquartile range (IQR) of the data set
a)
76
b)
43
c)
16
d)
92
150.
What is the IQR of the Cruisers?
a)
4
b)
6
151.
50% of the Car Hops went to 11 or fewer car shows.
a)
True
b)
False
152.
What percentage of the data is between 90 and 140?
a)
25 %
b)
50%
c)
75%
d)
100%