wayground logo

Free Printable Worksheets

NEW

Font size

S
M
L
XL
Worksheets

Scientific inquiry skills

Total questions: 56

Worksheet time: 1hrs 2mins

Name
Class
Date
1.
It is a measure of how close measurements come to each other when they are made in the same way
a)
Accuracy
b)
Precision
c)
Error
d)
Extrapolation
2.
a)
Student A
b)
Student B
c)
Student C
d)
Cannot be determined
3.
a)
Student A
b)
Student B
c)
Student C
d)
Cannot be determined
4.
a)
0.81%
b)
0.47%
c)
99.8%
d)
0.18%
5.
a)
Direct
b)
Inverse
c)
Extrapolated
d)
Interpolated
6.
What is the pressure of the gas at 25 mL?
a)
60 kPa
b)
50 kPa
c)
55 kPa
d)
70 kPa
7.
The distance from Earth to the moon is 384,400 km. Express the distance in meters using scientific notation
a)
3.844 x 10⁵
b)
3.844 x 10⁸
c)
3.844 x 10²
d)
3.855 x 10¹¹
8.

A pencil is 28.5 cm long; this would also be...

a)

2.85 mm

b)

285 mm

c)

0.0285 m

d)

2,850 km

9.

The ruler above could be used to make which of the following measurements? (The ruler's best ability)

a)

1.115 cm

b)

2.200 cm

c)

3 cm

d)

0.55 cm

10.

This graduated cylinder allows one to report this volume as...

a)

40 mL

b)

38 mL

c)

38.00 mL

d)

38.000 mL

11.

Which is an INCORRECT equality for decimal to scientific notation?

a)

0.0345 = 3.45 x 10⁻²

b)

34,500,000 = 3.45 x 10⁷

c)

3,450 = 3.45 x 10⁻³

d)

0.000345 = 3.45 x 10⁻⁴

12.

Convert this to decimal form: 9.87 x 10⁷

a)

98,700,000

b)

9,870,000,000

c)

0.000000987

d)

0.0000000987

13.

Convert this to scientific notation: 0.000567

a)

5.67

b)

5.67 x 10³

c)

5.67 x 10⁻³

d)

5.67 x 10⁻⁴

14.

Which ruler was used to make this measurement if it is reported as "6.8 cm"

a)
b)
c)
15.

A student uses a ruler to measure something and reports the length to be 3.0 x 101 (whatever units). Which ruler must they have used?

a)
b)
c)
d)
16.
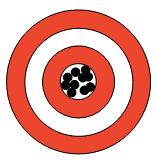
This bullseye demonstrates...
a)
High Accuracy & High Precision
b)
High Accuracy & Low Precision
c)
Low Accuracy & High Precision
d)
Low Accuracy & Low Precision
17.

How close a measurement is to the true value is called..

a)

Accuracy

b)

Precision

c)

Significant

d)

Estimate

18.
A set of data are all close to each other, but they are not close to the actual value.  This set of data can be described as...
a)
accurate
b)
precise
c)
both precise and accurate
19.
A set of data are all close to each other, and they are close to the actual value.  This set of data can be described as...
a)
accurate
b)
precise
c)
both precise and accurate
20.
?
a)
High Accuracy & High Precision
b)
High Accuracy & Low Precision
c)
Low Accuracy & High Precision
d)
Low Accuracy & Low Precision
21.
a)
positive trend
b)
negative trend
c)
no trend
22.
a)
positive trend
b)
negative trend
c)
no trend
23.
a)
positive trend
b)
negative trend
c)
no trend
24.
Does the plot show a positive trend, negative trend, or no trend?
a)
positive trend
b)
negative trend
c)
no trend
25.
Does the plot show a positive trend, negative trend, or no trend?
a)
positive trend
b)
negative trend
c)
no trend
26.
a)
positive trend
b)
negative trend
c)
no trend
27.
a)
positive trend
b)
negative trend
c)
no trend
28.
Which of the following lines represents the line of best fit for the scatter plot?
a)
A
b)
B
c)
C
d)
There is no line of best fit for this graph
29.
Which of the following lines represents the line of best fit for the scatter plot?
a)
A
b)
B
c)
C
d)
D
30.
Which of the following lines represents the line of best fit for the scatter plot?
a)
A
b)
B
c)
C
d)
D
31.
Which of the following lines represents the line of best fit for the scatter plot?
a)
There is no line of best fit for this graph.
b)
B
c)
C
d)
D
32.
Which of the following lines represents the line of best fit for the scatter plot?
a)
A
b)
B
c)
C
d)
D
33.
Which of the following lines represents the line of best fit for the scatter plot?
a)
A
b)
B
c)
C
d)
D
34.
Which of the following lines represents the line of best fit for the scatter plot?
a)
A
b)
B
c)
C
d)
There is no line of best fit for this graph because there is no trend.
35.
Which of the following lines represents the line of best fit for the scatter plot?
a)
A
b)
B
c)
C
d)
There is no line of best fit for this graph because there is no trend.
36.
Which of the following lines represents the line of best fit for the scatter plot?
a)
A
b)
B
c)
C
d)
There is no line of best fit for this graph because there is no trend.
37.
Which of the following lines represents the line of best fit for the scatter plot?
a)
A
b)
B
c)
C
d)
D
38.
Which kind of pet do exactly five people have? 
a)
snake
b)
cat
c)
dog
d)
fish
39.
Which kind of pet do exactly five people have? 
a)
snake
b)
cat
c)
dog
d)
fish
40.
How many more students own a dog than a hamster? 
a)
2
b)
4
c)
5
d)
6
41.
Do fewer students own a cat or a dog? 
a)
cat
b)
dog
42.
How many more students own a cat or a dog combined than a snake?
a)
2
b)
7
c)
9
d)
11
43.
Which sport is the least favorite? 
a)
baseball
b)
football
c)
hockey
d)
basketball
44.
How many fewer people liked hockey than football? 
a)
3
b)
5
c)
8
d)
11
45.
A possible explanation to a problem that has not yet been tested. 
a)
data
b)
theory
c)
hypothesis
d)
fact
46.
What step does every scientific experiment begin with?
a)
hypothesis
b)
question/problem
c)
procedures
d)
conclusion
47.
The summary at the end of an experiment that explains the results. 
a)
conclusion
b)
procedures
c)
materials
d)
responding variable
48.
A series of steps used by scientists to solve a problem or answer a question. 
a)
scientific method
b)
recipe
c)
data collection
d)
metric system
49.
Observations made during an experiment are called:
a)
results
b)
problems
c)
conclusions
d)
questions
50.
This part of the experiment serves as a basis of comparison; the one variable being tested has been omitted. 
a)
experimental group
b)
control group
c)
data
d)
variables
51.
This variable in an experiment is the one being deliberately changed by the scientist. 
a)
dependent variable
b)
independent variable
c)
data
d)
control group
52.
An experiment is performed on plants to see how different liquids affect plant growth. Each plant in the experiment is given a different liquid; water, apple juice, or milk. Each plant has the same amount of soil, sunlight, and listens to the same music. In this investigation, the independent variable is ...
a)
The type of plant
b)
The amount of sunlight
c)
The type of music
d)
The type of liquid
53.
The summary at the end of an experiment that explains the results. 
a)
conclusion
b)
procedures
c)
materials
d)
responding variable
54.
A student wants to test the effects of type of exercise on heart rate.  What is the dependent variable?
a)
heart rate
b)
type of exercise
c)
amount of exercise
d)
time of day exercise occurs
55.
An experiment is performed on plants to see how different liquids affect plant growth. Each plant in the experiment is given a different liquid; water, apple juice, or milk. Each plant has the same amount of soil, sunlight, and listens to the same music. In this investigation, what are the controlled variables?
a)
Type of plant, amount of music, and sunlight
b)
Water, apple juice, milk
c)
Plant growth
56.
An experiment is performed on plants to see how different liquids affect plant growth. Each plant in the experiment is given a different liquid; water, apple juice, or milk. Each plant has the same amount of soil, sunlight, and listens to the same music. In this investigation, the independent variable is ...
a)
The type of plant
b)
The amount of sunlight
c)
The type of music
d)
The type of liquid