
 Worksheets
Motion in 1 Dimension Review
Total questions: 70
Worksheet time: 2hrs 20mins


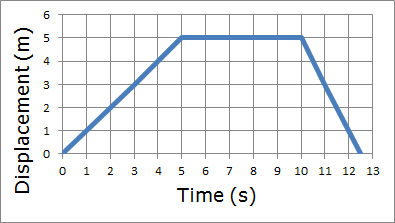
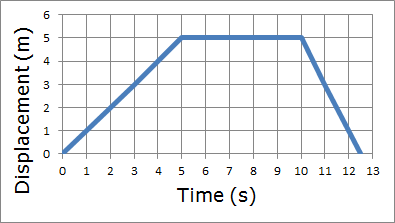


Constant speed in a constant direction is
constant velocity.
constant acceleration.
instantaneous speed.
average velocity.
A feather is dropped on the moon from a height of 1.40 meters. The acceleration of gravity on the moon is 1.67 m/s2. Determine the time for the feather to fall to the surface of the moon.
Which number represents acceleration?
a = 1.40m
a= 1.67m/s2
a = 0m/s
a= ?
A feather is dropped on the moon from a height of 1.40 meters. The acceleration of gravity on the moon is 1.67 m/s2. Determine the time for the feather to fall to the surface of the moon.
Which number represents initial velocity?
v0 = 1.40m
v0= 1.67m/s2
v0 = 0m/s
v0= ?
A feather is dropped on the moon from a height of 1.40 meters. The acceleration of gravity on the moon is 1.67 m/s2. Determine the time for the feather to fall to the surface of the moon.
Which number represents displacement?
x= 1.40m
x= 1.67m/s2
x = 0m/s
x= ?
A feather is dropped on the moon from a height of 1.40 meters. The acceleration of gravity on the moon is 1.67 m/s2. Determine the time for the feather to fall to the surface of the moon.
Which equation should you use to solve the above problem?


A bike accelerates uniformly from rest to a speed of 7.10 m/s over a distance of 35.4 m. Determine the acceleration of the bike.
What number represents initial velocity?
v0 = 0m/s
v0 = 7.10m/s
v0 = 35.4m
v0 = ?
A bike accelerates uniformly from rest to a speed of 7.10 m/s over a distance of 35.4 m. Determine the acceleration of the bike.
What number represents final velocity?
v = 0m/s
v = 7.10m/s
v = 35.4m
v = ?


What is the formula for speed?
speed = distance x time
speed=distance / time
speed = time / distance
speed = distance + time
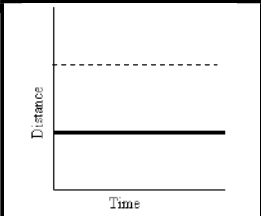
What does the solid line on this graph represent?
Constant speed
Acceleration
At rest
deceleration
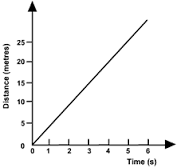
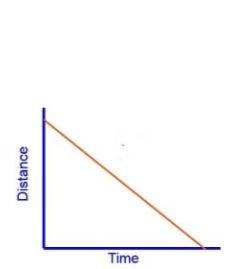
What is the line on this graph showing?
moving away from starting point at a constant speed
moving back towards the starting point at a constant speed
acceleration (getting faster)
deceleration (getting slower)
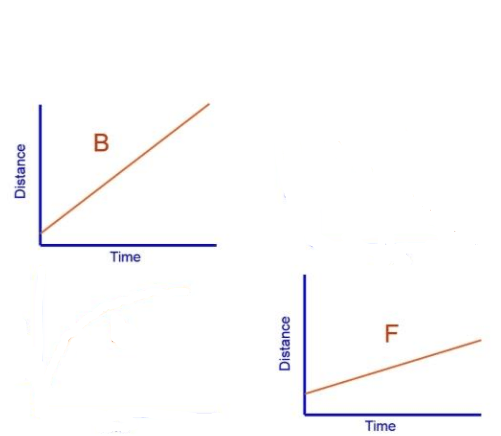
What is this line of this graph showing?
moving away from starting point at a constant speed
moving back towards the starting point at a constant speed
acceleration (getting faster)
deceleration (getting slower)



What happened during A to B point?
not moving
increasing speed at a constant rate
moving at a constant speed
acceleration


What happened during E to F point?
not moving
increasing speed at a constant rate
constant speed
acceleration

What happened during B to C point?
deceleration
constant speed
at rest
acceleration
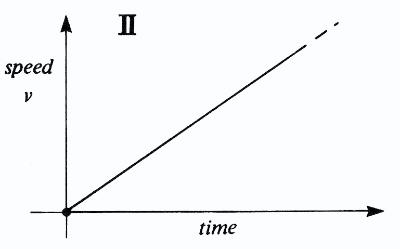
what is the motion described in the graph
all of above
constant speed
acceleration
constant position

What does this graph represent?
Constant speed
Acceleration
Not moving

What is occurring on this graph? Select 2.
speeding up in the negative direction
constant negative acceleration
constant positive acceleration
slowing down in the negative direction
positive change in momentum

What is occurring on this graph? Select 2.
slowing down in the negative direction
constant negative acceleration
constant positive acceleration
slowing down in the positive direction
positive change in momentum

During which interval is the object speeding up?
A to B
B to C
D to E
E to F

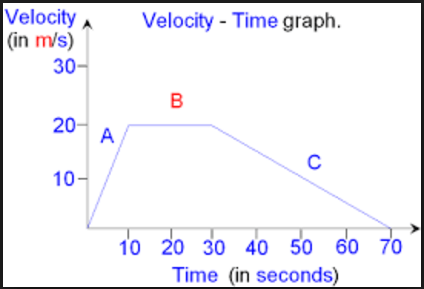


What is occurring on this graph?
slowing down in the positive direction
moving at a constant speed in the positive direction
positive change in momentum
positive net force
This graph represents slowing down in the positive direction then speeding up in the positive direction.



