Worksheets
Biology AB Post Test
Total questions: 75
Worksheet time: 43mins

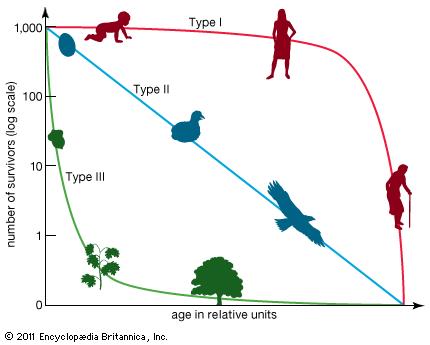
The mortality rate of organisms following a type I survivorship curve is __________.
fairly constant throughout life
higher in post-reproductive years
lower after the organisms become established
unrelated to age
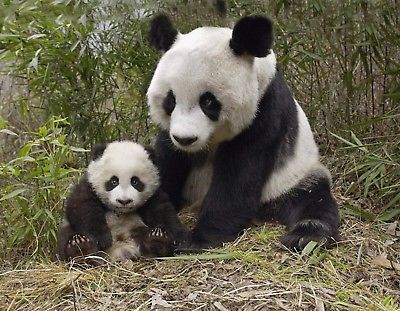
Animals such as pandas are long lived, mature slowly, and generally produce fewer offspring during their life spans but place a greater investment in each. What term is applied to this type of reproductive strategy?
K-strategy
r-strategy
Which contribute to a positive population growth?
immigration
positive birth rate
emigration
positive death rate
Which of the following is NOT an outcome of high population density?
mortality increase
predators tend to ignore prey that is overabundant
reduction in births
decreased resource availability

Which of the following describes the population of elephants in Kenya from 1973-1989?
(immigration + births) – (emigration + deaths) = 0
(immigration + births) – (emigration + deaths) = 1
(immigration + births) – (emigration + deaths) < 0
(immigration + births) – (emigration + deaths) > 0
A population’s emigration in one month totaled 2 individuals. During the same period, immigration was 12 individuals. Natality (births) was 8, and mortality was 15 due to a parasite infection. What was the net effect on the population size?
+5
+3
0
-4
What type of factor has an increasing impact as the population size increases?
density-independent
density-dependent
cohort effect
survivorship factor
Which of the following are density dependent factors?
competition for resources
predation
disease
natural disasters
Which of the following are examples of a density independent factors?
forest fire
seasonal cycles
storms
disease
Factors like predation can have a positive benefit to the population of prey organisms because predators tend to keep prey populations below their ___________.
carrying capacity
sustainibility number
exponential growth point
competition level
As a population of a species increases within a territory, which of the following most likely also increases?
Immigration
Food supply
Carrying capacity
Competition
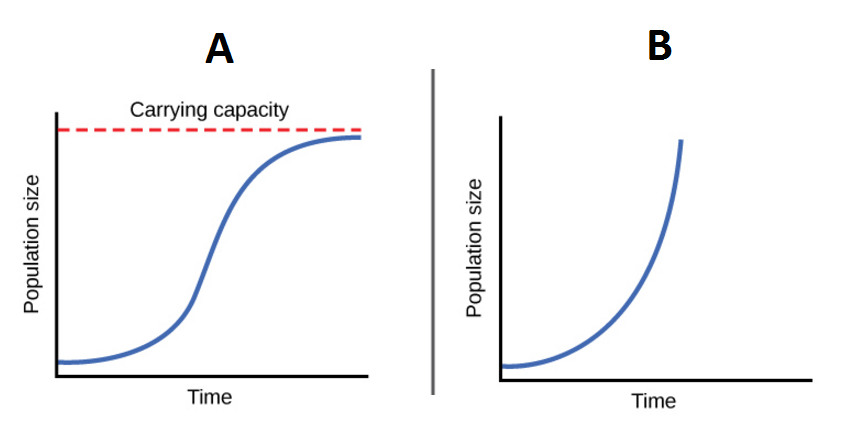
What type of growth model is shown in image A?
Exponential
Logistic
What type of growth model is shown in image B?
Exponential
Logistic
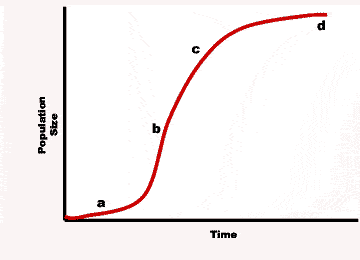
What point on the graph represents carrying capacity?
a
b
c
d
At carrying capacity, a population __________.
increases rapidly
increases slowly
decreases slowly
is in dynamic equilibrium
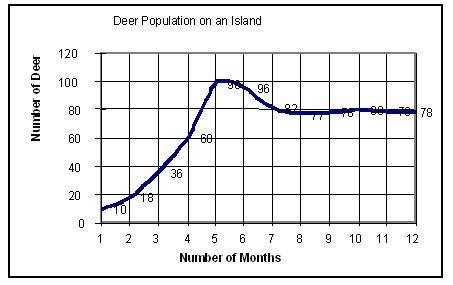
Which choice most closely approximates the deer population's carrying capacity based on the graph?
100
80
60
10
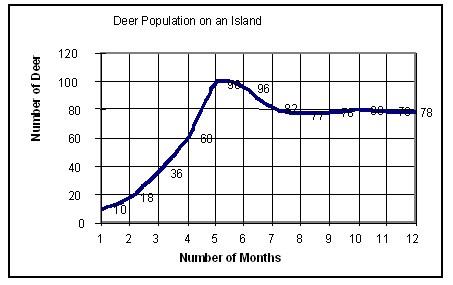
Which mathematical model most closely describes the population growth curve shown in deer population graph from the previous question?
logistic growth
exponential growth
Which of the following populations is most likely to go extinct?
a very small population in an unstable environment
a moderate-sized population of r strategists
a large population with lots of genetic variability
all would be equally likely to go extinct
What is the the closest approximation of the size of the human population today?
850 million
7.5 billion
20.8 billion
1.7 trillion

Which population growth model most closely describes the human population in the modern age?
logistic growth
exponential growth
upward growth
tumor growth
Within the carbon cycle, anything that absorbs more carbon from the atmosphere than it releases.
carbon sink
carbon source
Within the carbon cycle, anything that releases more carbon into the atmosphere than it absorbs.
carbon sink
carbon source
Select all that apply.
Which of the following are carbon sources.
fossil fuel combustion
volcanic eruptions
forests
oceans
Select all that apply.
Which of the following are carbon sinks.
soil and rocks
fossil fuels
forests
oceans

Forests are carbon sinks because they remove carbon dioxide from the atmosphere through ____________.
combustion
respiration
photosynthesis
decomposition
Human activities add greenhouse gases to the atmosphere, therefore we are carbon ________.
sinks
sources

The total set of carbon emissions caused by an individual.
carbon cycle
carbon handprint
carbon footprint
carbon summary
The main human activity that adds to an individual's carbon footprint.
usage of alternative energies (wind, solar, etc)
respiration and growth
photosynthesis by plants
usage of fossil fuels for energy
Select all that apply.
You can help decrease your carbon footprint by...
buying and eat locally-produced food
lessening your amount of driving
recycling
decreasing your water and electricity usage