
 Worksheets
motion graphs and speed problems
Total questions: 75
Worksheet time: 2hrs 4mins




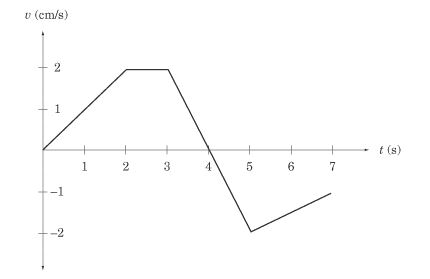
What is happening between 2 and 3 seconds?
The object is not moving.
The object is not accelerating.
The object is slowing down.
The object is speeding up.
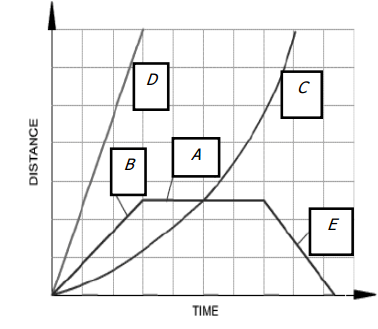

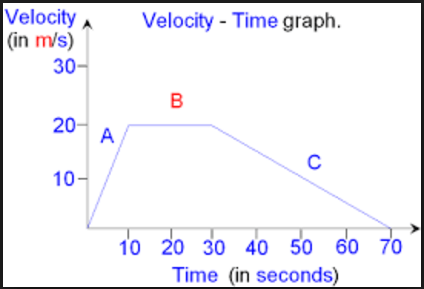
- What is the distance covered through the second segment, which is between 50 seconds, and 70 seconds?
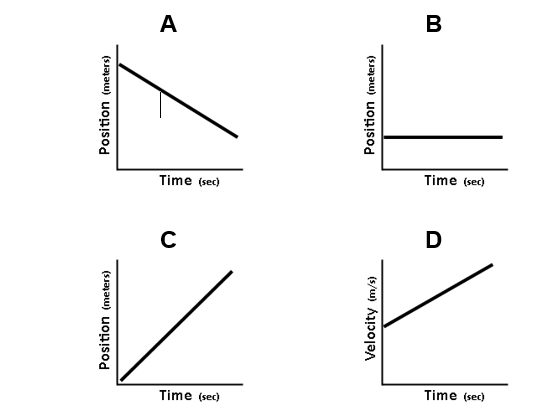


During which interval is the object speeding up?
A to B
B to C
D to E
E to F
What is the formula for speed?
speed = distance x time
speed=distance / time
speed = time / distance
speed = distance + time
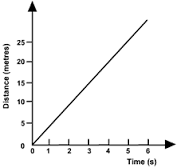
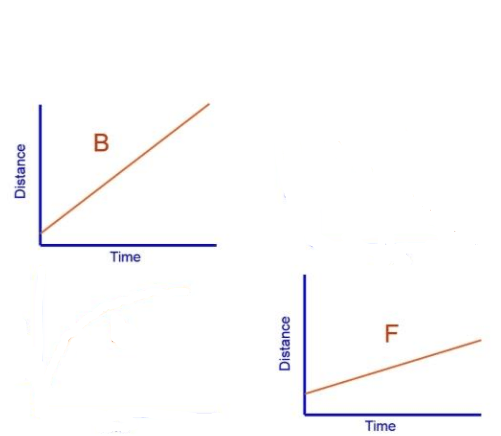
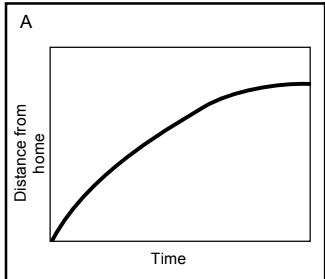
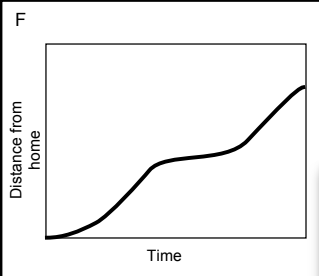
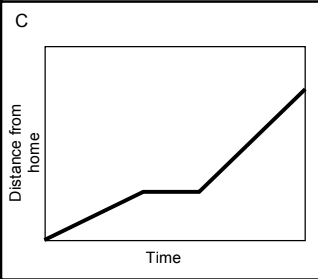
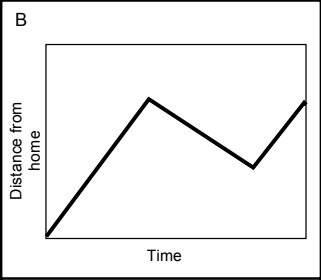
What is the line on this graph showing?
moving away from starting point at a constant speed
moving back towards the starting point at a constant speed
acceleration (getting faster)
deceleration (getting slower)
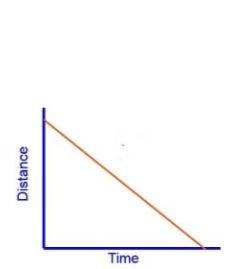
What is this line of this graph showing?
moving away from starting point at a constant speed
moving back towards the starting point at a constant speed
acceleration (getting faster)
deceleration (getting slower)


What is represented by this graph?
constant speed
not moving
speed increasing
speed increasing at a constant rate
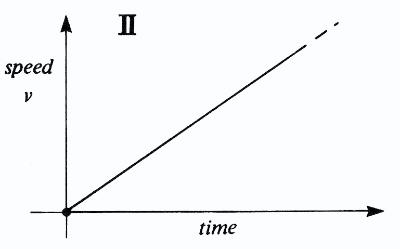
what is the motion described in the graph
all of above
constant speed
acceleration
constant position


What happened during E to F point?
not moving
increasing speed at a constant rate
constant speed
acceleration

What happened during B to C point?
deceleration
constant speed
at rest
acceleration

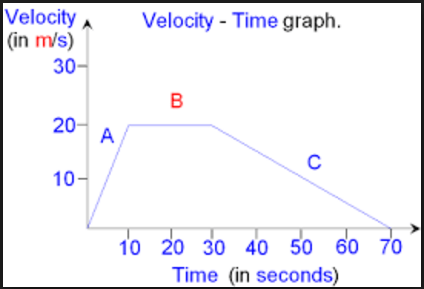
This is a velocity-time graph. What is the object doing in segment A?
Speeding up
Slowing down
Constant Velocity
Not moving


On this velocity vs time graph, describe the motion of A.
positive velocity
negative velocity
positive acceleration
negative acceleration
On this velocity vs time graph, describe the motion of C.
constant positive velocity
constant negative velocity
positive acceleration
negative acceleration
On this velocity vs time graph, describe the motion of D.
constant positive velocity
constant negative velocity
positive acceleration
negative acceleration

What is the velocity at 12.5 seconds?
0 m/s
2 m/s
10 m/s
20 m/s

Which car won the race?
Blue
Green
Yellow
The Red one...yeah.

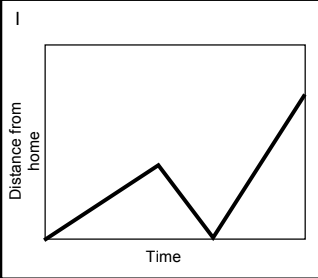
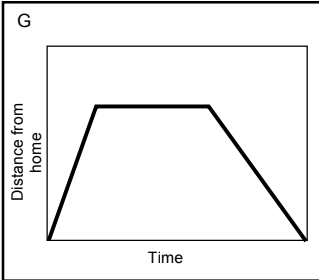
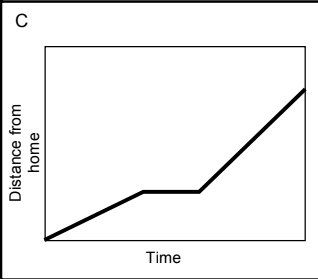
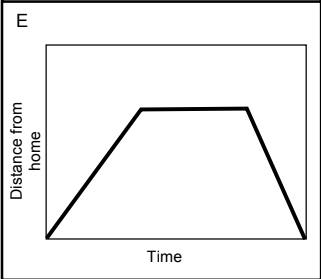
This motion graph represents:
Someone running home and then resting.
Someone walking home and then resting.
Someone leaving home, resting for a short period, and then running home.
Someone eating a pizza and then turning on a lamp. That's chemical energy to mechanical energy. Pick me.

What does this motion graph represent?
Two race car drivers wait forever and then drive home.
Two race car drivers wait forever and then take off when the light turns green.
Two race car drivers that wait forever and then wait a little longer.
Two race car drivers agree to re-think their life goals.

Which runner arrived in second place?
Green
Blue
Both tied!
"The truth points to itself," said Mog the Magnificent.



If a puppy runs across a park at a speed of 15 m/s. The puppy has a time of 5 seconds. How far did the puppy run?
75 m
30 m
45 m
105 m






What is the equation to calculate time?
time = speed/distance
time = distance/speed
time = speed x distance
time = distance x speed

What is the equation to calculate distance?
distance = speed/time
distance = time/speed
distance = speed/distance
distance = speed x time

