wayground logo

Free Printable Worksheets

NEW

Font size

S
M
L
XL
Worksheets

Physics Basics

Total questions: 50

Worksheet time: 2hrs 53mins

Name
Class
Date
1.

Convert the following to millimeters: 0.485 km

a)

48,500 mm

b)

485 mm

c)

485,000 mm

d)

4,850,000 mm

2.
The length of a desk is 3.5 feet. How many centimeters is the length? 
(there are 2.54 cm in an inch)
a)
60
b)
120.23
c)
106.68
d)
117.12
3.
How many minutes are in a year?
a)
I can't count that high.
b)
525,600min
c)
52,560min
d)
31,536,000min
4.
A passenger jet has a speed of 900 km/h.
What is its speed in m/s?
(1 km = 1000 m)
a)
250 m/s
b)
324 m/s
c)
1,500 m/s
d)
2,500 m/s
5.
A bicycle has a speed of 6 m/s. What is its speed in km/h?  (1 km=1000 m)
a)
21.6 km/h
b)
16.67 km/h
c)
2.16 km/h
d)
1.67 km/h
6.
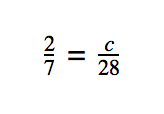
Solve the proportion:
a)
4
b)
8
c)
14
d)
10
7.

True or False, a measurement MUST contain a unit.

a)

True

b)

False

8.
211 lb=? kg
1kg =2.2 lb
a)
95794.0
b)
95.90
c)
9.59x10^-11
d)
.9590
9.

Convert 300 meters to centimeters:

a)

3000 cm

b)

0.3 cm

c)

30,000 cm

d)

3 cm

10.
1 L = _______ mL
a)
1
b)
10
c)
100
d)
1000
11.
What does the term kilo mean?
a)
100
b)
10
c)
.001
d)
1000
12.
m stands for....
a)
millimeter
b)
meter
c)
centimeter
d)
Liter
13.
1 Meter = ______cm
a)
100
b)
10
c)
1
d)
1000
14.

Target on the right, how would it be described?

a)

Accurate

b)

Precise

c)

Accurate and Precise

d)

Neither Accurate or Precise

15.

Target on the left, how would it be described?

a)

Accurate

b)

Precise

c)

Accurate and Precise

d)

Neither Accurate or Precise

16.

Houston has approximately 2.21 million people. Each person has 2 hands and each hand has 5 fingers. How

many fingers are in Houston? Answer in scientific notation, using the correct number of sig figs.

a)

2.21 x 10¹¹ fingers

b)

2.21 million fingers

c)

2.21 x 10⁶ fingers

d)

2.21 x 10⁷ fingers

17.

How many centimeters are in an inch?

a)

2.54 inches

b)

2.54 cm

c)

12 inches

d)

10 cm

18.
Why is the metric system considered to be a "convenient" system of measure?
a)
The prefixes are in multiples of 10.
b)
Everybody around the world knows and understands metric measure.
c)
All units are spelled in Latin.
d)
The measure for temperature is the same as the measure for amperes.
19.
What prefix represents 10^3?
a)
milli
b)
deca
c)
centi
d)
kilo
20.

How many meters to a kilometer?

a)

1000

b)

100

c)

10

d)

100.0

21.
It is a measure of how close measurements come to each other when they are made in the same way
a)
Accuracy
b)
Precision
c)
Error
d)
Extrapolation
22.
a)
Student A
b)
Student B
c)
Student C
d)
Cannot be determined
23.

How close a measurement is to the accepted value is called..

a)

Accuracy

b)

Precision

c)

Significant

d)

Estimate

24.
This bullseye demonstrates...
a)
High Accuracy & High Precision
b)
High Accuracy & Low Precision
c)
Low Accuracy & High Precision
d)
Low Accuracy & Low Precision
25.
?
a)
High Accuracy & High Precision
b)
High Accuracy & Low Precision
c)
Low Accuracy & High Precision
d)
Low Accuracy & Low Precision
26.

Which Student is the most Precise?

a)

Alex

b)

Shandra

c)

Luis

27.
A set of data are all close to each other, but they are not close to the actual value.  This set of data can be described as...
a)
accurate
b)
precise
c)
both precise and accurate
28.
A set of data are all close to each other, and they are close to the actual value.  This set of data can be described as...
a)
accurate
b)
precise
c)
both precise and accurate
29.
length?
a)
3.2 cm
b)
3.12 cm
c)
3 cm
d)
3.219 cm
30.
The metal is 7.1 cm long
a)
7 is the estimated digit
b)
1 is the estimated digit
c)
7 is the uncertain digit
d)
Both 7 and 1 are estimated digits
31.

The line graph shows five years of data about a dog. What information does the graph show?

a)

How the mass of the dog changed.

b)

How much food the dog consumed.

c)

What kinds of food the dog consumed.

d)

When the dog was measured each month.

32.

What is the independent variable in the dog data graph?

a)

Dog's Mass (kg)

b)

Year

33.
Experiment: How does watching TV during studying affect a student’s test grades?

The students grades are the ___________ variable.
a)
independent
b)
dependent
34.
The dependent variable is the one
a)
you measure.
b)
you change.
35.
The purpose of graphs, charts and tables is to
a)
help scientists visualize results from an experiment.
b)
make the experiment look nice.
c)
practice what I learned in Math class.
d)
Practice my drawing skills.
36.

Which type of container keeps liquid the hottest for the longest time?

a)

Bag

b)

Cooler

c)

Cooler and bag are tied

d)

Styrofoam

37.
Which of the following is not the correct way to show the slope of the line?
a)
best fit line
b)
best fit curve
c)
connect the points
38.
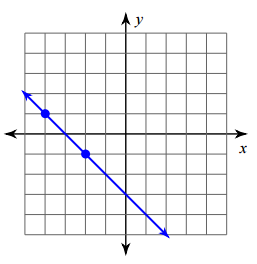
Find the slope of the line.
a)
-2
b)
2
c)
-1
d)
1
39.
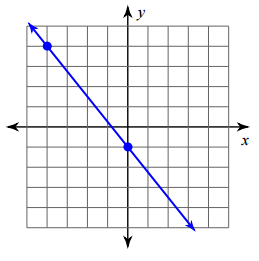
Find the slope of the line.
a)
-5/4
b)
5/4
c)
-4/5
d)
4/5
40.
What is the slope in the picture?
a)
Positive
b)
Negative
c)
Zero
d)
Undefined
41.
What is the slope in the picture?
a)
Positive
b)
Negative
c)
Zero
d)
Undefined
42.
Find the slope of the line.
a)
1/2
b)
-1/2
c)
2/1
d)
-2/1
43.
Find the slope of the line.
a)
1/4
b)
-1/4
c)
-4/1
d)
4/1
44.
Find the slope
a)
-5/7
b)
7/5
c)
-7/5
d)
5/7
45.
Find the slope
a)
-2/3
b)
3/2
c)
-3/2
d)
2/3
46.

Solve F = ma for a

a)

a= m/F

b)

a=F/m

c)

a= F- m

d)

a= F + m

47.

Solve x = vt for v

a)

v = x- t

b)

v= t/x

c)

v = x/t

d)

v = x+t

48.

solve x = 1/2 a t2 for a

a)

a = 1/2 x t2

b)

a = 1/2 x / t2

c)

a= square root (2x / t)

d)

a = 2x / t2

49.

Solve for t.


(t / 6) = 4

a)

t = 1.5

b)

t = 24

c)

t = 2

d)

t = 0.67

50.

Vf2 = Vi2 + 2ad, solve for Vi =

a)
b)
c)
d)