
Font size
 Worksheets
MEASURE OF DISPERSION
Total questions: 33
Worksheet time: 52mins
Which of the following is not a measure of dispersion?
range
variance
standard deviation
mode
Which of the measures of location is used in computing for the variance of a distribution?
mean
median
mode
midrange
It is defined as the square root of the variance.
coefficient of variation
midrange
standard deviation
kurtosis
If the dispersion is small, then the values in the distribution is close to the median.
true
false
Which of the measures of dispersion only uses two values in the distribution?
range
standard deviation
variance
mean deviation
Which of the following is a characteristic of the range? Check all that apply.
All values in the distribution are used in the calculation.
It is influenced by extreme values.
It is dependent on the mean.
It is easy to compute and to understand.
Which of the following is a property of the standard deviation? Check all that apply.
It can be negative.
All the values in the distribution are used in computing for the standard deviation.
It is in the same units as the original data
It is the most widely reported measure of dispersion.

The table shows the distribution of sizes of branded trousers sold in a departmental store. Calculate the standard deviation of the distribution of data.
3.29
3.59
10.85
12.69

Calculate the standard deviation of the set of data.
137.64
130.25
11.73
11.41

The stem-and-leaf plot is for the sample height (in centimetre) for a rose plants herbs. Determine the first quartile for this set of data.
135 cm
171 cm
156 cm
188 cm

Table shows the product of frequency and mass. The sum of the frequency is 25. Find the value of n.
15
2
45
3

Diagram shows a set of 7 values of data, where k is an integer. The mode of the set of data is 7 and the median is 5. An integer, 8 is added to the original set of data. Calculate the new mean of the data.
4.75
5.43
5.75
6.57

(a)
Find the standard deviation for the following data; 86, 95, 78, 67, and 85.
82.2
5
9.33
10.43

The heights of some students are given.
158cm 172cm 164cm
164cm 167cm 159cm
What is the range of the heights?
13cm
14cm
164cm
330cm
Set 1-Standard Deviation=3.1
Set 2-Standard Deviation=4.9
Set 3-Standard Deviation=1.7
Set 4-Standard Deviation=3.2
Which set of data probably has the points closest to the mean?
A(n) ____ of a data set is much greater or much less than the other data values.
mean
median
mode
outlier

What is the median on this box pot?
52
54
56
63

Find the Value of Data Range for the above data
60
59
58
61
⋅
Class Interval f
1-10 3
11-20 4
21-30 7
31-40 16
41-50 6
51-60 4
Find the Value of mean , x for the above data
32
32.5
33.5
33
10 , 20 , 25 , 30
Calculate Standard Deviation
70.92
72.92
74.92
76.92

What does this symbol represents?
Data
Mode
Variance
Mean


12, 10, 10, 10, 13, 12, 11, 13, 10

Dispersion measures
The scatterness of a set of observation
The concentration of a set of observations
Both (a) and (b)
Neither (a) and (b)
The most commonly used measure of dispersion is
Range
Quartile deviation
Standard deviation
Coefficient of variation
In order to find the median, the data must be sorted from least to greatest first.
True
False
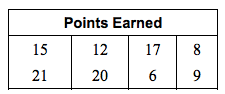
The table shows the points earned by contestants in a competition. Find the range and the interquartile range of the points.
Range: 15; IQR: 13
Range: 15; IQR: 12
Range: 15; IQR: 11
Range: 15; IQR: 10
Calculate the interquartile range of the following data: 17, 18, 18, 19, 20, 21, 21, 23, 25
3
8
4
5

