
 Worksheets
ECONOMICS Semester 2 Year 10 Exam Prep 2021
Total questions: 115
Worksheet time: 1hrs 20mins
Competition and profit motive are important characteristics of a:
command economy
traditional economy
market economy
socialist economy
An economic system in which individuals and businesses make decisions about what to produce.
Market economy
Mixed economy
Communism
Command economy
the government is responsible for ...sector provision
private
public
foreign
financial
The total remuneration that the owners of production factors receive is called national...
production
expenditure
exports
income
An indication of long-term growth in the economy is referred to as the.........
trend line
amplitude
length
trough
Inflation is known as:
a decrease in the price of goods and services.
an increase in the price of good and services.
a decision making strategy
a step in the decision making process.
Which of the following is NOT a characteristic
of natural resources?
They have an unlimited supply.
They are unevenly distributed
They need to be processed before they have a use
They are equally distributed.
Which method is being used to calculate GDP?
Production method
Income method
Expenditure method
Value added method
Those who are willing and able to work at the current wage rate but do not have a paid job
Employed
Involuntary unemployed
Voluntary unemployed
Those who are not willing and able to work at the current wage rate and do not have a job.
Employed
Involuntary unemployed
Voluntary unemployed
Unemployment caused by an imbalance between the skills of workers and the requirements of employers
Employed
Structural unemployment
Frictional unemployment
Voluntary unemployment
Cyclical unemployment
Short-term temporary unemployment caused by people being temporarily between jobs or entering the job market for the first time
Employed
Structural unemployment
Frictional unemployment
Voluntary unemployment
Cyclical unemployment
Unemployment caused by a downturn in economic activity
Employed
Structural unemployment
Frictional unemployment
Voluntary unemployment
Cyclical unemployment
Demand for labour comes from
Producers
Consumers
Government
Supply of labour comes from
Producers
Households
Government
Those who are willing and able to work at the current wage rate and have a paid job
Employed
Structural unemployment
Frictional unemployment
Voluntary unemployment
Cyclical unemployment
An increase in business confidence will cause what change?
Increase in AD
Decrease in AD
Increased AS
Decrease in AS
An increase in income tax will cause what change?
Increase in AD
Decrease in AD
Increased AS
Decrease in AS
An increase in oil prices will cause what change?
Increase in AD
Decrease in AD
Increased AS
Decrease in AS
An increase in worker productivity?
Increase in AD
Decrease in AD
Increased AS
Decrease in AS
An increase in worker productivity?
Increase in AD
Decrease in AD
Increased AS
Decrease in AS

An increase in the min wage causes involuntary unemployment to
Increase
Decrease
Stay the same
Why does an increase in the min wage cause the quantity demanded for labour to fall?
Producers don't require as many workers
Producers are less willing and able to employ as many workers as their costs of production has increases
Less people are willing to work
Less people are able to work
Consumption spending is affected by what factors?
Exchange rate
Consumer confidence
Business confidence
Interest rates
Income tax
Investment spending is affected by what factors?
Exchange rate
Consumer confidence
Business confidence
Interest rates
Income tax
Which of the following is applicable to the economic concept of unemployment
It is a stock concept
The unemployed are those not in work but are actively seeking work
The number of unemployed is measured at a point in time
The labour force excludes those who are considered to be inactive
Identify the correct definition of the unemployment rate
The number of those in work as a percentage of the population of working age people
The number of those unemployed as a percentage of the population of working age people
The number of those unemployed as a percentage of the labour force
The number of those not in work and unemployed as a percentage of the population of working age people
Which of the following is not an example of supply-side unemployment
Frictional
Seasonal
Cyclical
Structural
Which of the following occupations might be subject to seasonal unemployment
Agricultural labourers
Bus drivers
Landscape gardeners
Operations manager in a frozen food factory
Which of the following might solve the problem of regional unemployment?
Making cheap rented accommodation available in areas with low unemployment and many unfilled job vacancies
Making cheap rented accommodation available in areas of high unemployment
Giving grants to firms to set up in areas of low unemployment
Building more vocational training colleges in areas of high employment
Real wage unemployment may be caused by which of the following
Minimum wage legislation
Generous welfare payments
Geographical immobility
Powerful trade unions
Which of the following is most likely to occur during a period of low unemployment?
Investment in new technology by businesses
Government will abolish minimum wage
Rapid wage inflation
Rapid rise in trades union membership
How does a production possibility curve show that scarcity exists?
It shows that a rise in demand for one of the products increases its price.
It shows that as more resources are used to produce a product, its price rises.
It shows that at any point outside the production possibility curve an economy is wasting
resources.
It shows that there is a limit to the quantity of products that can be produced with existing resources and technology.

An economy produces different types of goods using its limited resources. This can be illustrated by a production possibility curve.
What does point X on the production possibility curve show?
All resources are used for the production of consumer goods.
More resources are allocated to producing capital goods than consumer goods.
Resources are allocated to produce a mixture of consumer and capital goods.
Total resources are not being fully utilised for production of these goods.

The diagram shows two production possibility curves for an economy.
What could have caused the change in the economy’s production possibility curve from XX
to YY?
a decrease in the price level
a large number of industrial disputes
a major earthquake
an increase in unemployment

The diagram shows a production possibility curve for an economy that can provide financial services or agricultural products. The economy is at point X.
Bad weather destroys part of the agricultural produce.
At which point will the economy be in the diagram?
A
B
C
D

The diagram shows a production possibility curve for an economy that can produce agricultural products or financial services. It is currently at point Q.
A crop disease decreases agricultural production but the financial services sector increases output as a result of an increase in demand.
To which point is the economy likely to move?
A
B
C
D

The diagram below shows a production possibility boundary for an economy that produces goods and services.
From the diagram it can be concluded that
point X is productively efficient and point Y is allocatively
efficient.
point Y is productively efficient and point X is allocatively
efficient.
points X and Y are allocatively efficient.
points X and Y are productively efficient.

The following diagram shows the production possibility frontier for an economy that produces bread and honey.
If the economy is initially at point W, then the opportunity cost of moving to point X is
6 units of honey.
8 units of honey.
12 units of bread.
23 units of bread.

The diagram below shows two production possibility boundaries for an economy.
The movement of the boundary from EE to FF is likely to have occurred because
consumers have switched their preferences from textiles to computers.
there has been an increase in productivity in the computer industry and a decrease in productivity in the textiles industry.
the production of computers has become more profitable than the production of textiles.
economic resources are being underused in the textiles industry.

If a point lies on the curve this means the company/country/individual is being efficient. If a point lies inside the curve, what does that tell?
They are being over efficient
There is an idle, or unproductive, or use of resources
It is not impossible with the given resources
They are still efficient, just at another point

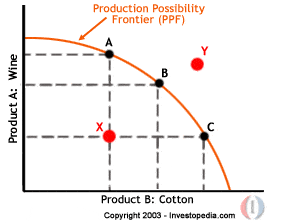
What does point B represent?
Production at greater than the country's minimum potential
Production is less than the country's minimum potential
Production is greater than the country's maximum potential
Production at the country's maximum potential

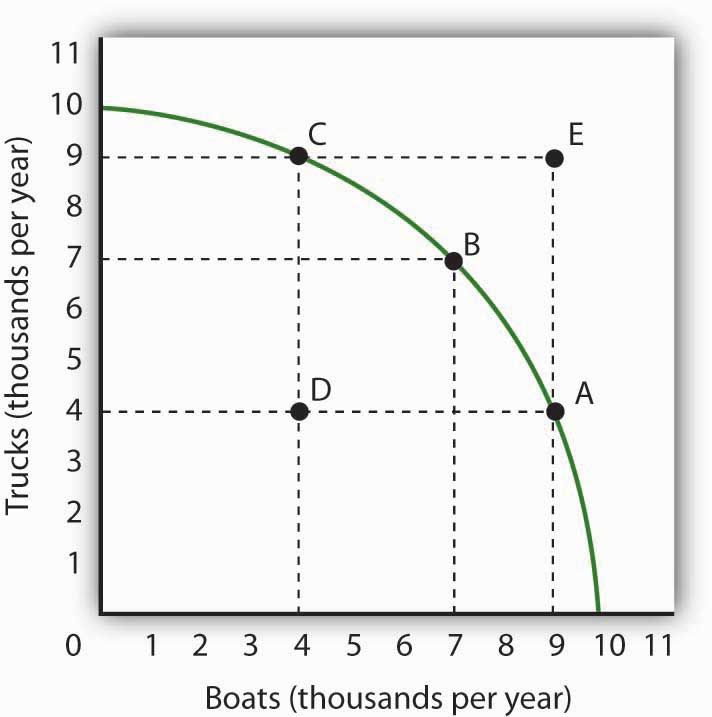
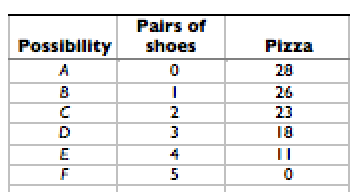
Economic growth affects the PPC by...
shifting inward
shifting outward
causing no change at all
turning it into a straight line
Suppose that a new machine that speeds up automotive production is introduced into the auto industry. This would cause the PPC to
shift outward
shift inward
do nothing
not enough information is provided
How does a production possibility curve show that scarcity exists?
It shows that a rise in demand for one of the products increases its price.
It shows that as more resources are used to produce a product, its price rises.
It shows that at any point outside the production possibility curve an economy is wasting
resources.
It shows that there is a limit to the quantity of products that can be produced with existing resources and technology.
The diagram shows a production possibility curve for an economy that can produce agricultural products or financial services. It is currently at point Q.
A crop disease decreases agricultural production but the financial services sector increases output as a result of an increase in demand.
To which point is the economy likely to move?
A
B
C
D
The diagram below shows a production possibility boundary for an economy that produces goods and services.
From the diagram it can be concluded that
point X is productively efficient and point Y is allocatively
efficient.
point Y is productively efficient and point X is allocatively
efficient.
points X and Y are allocatively efficient.
points X and Y are productively efficient.
The following diagram shows the production possibility frontier for an economy that produces bread and honey.
If the economy is initially at point W, then the opportunity cost of moving to point X is
6 units of honey.
8 units of honey.
12 units of bread.
23 units of bread.

The missing label in the CFI diagram is...?
Government Sector
Financial Sector
Households
Firms

The missing label in the CFI diagram is...?
Government Sector
Financial Sector
Households
Firms
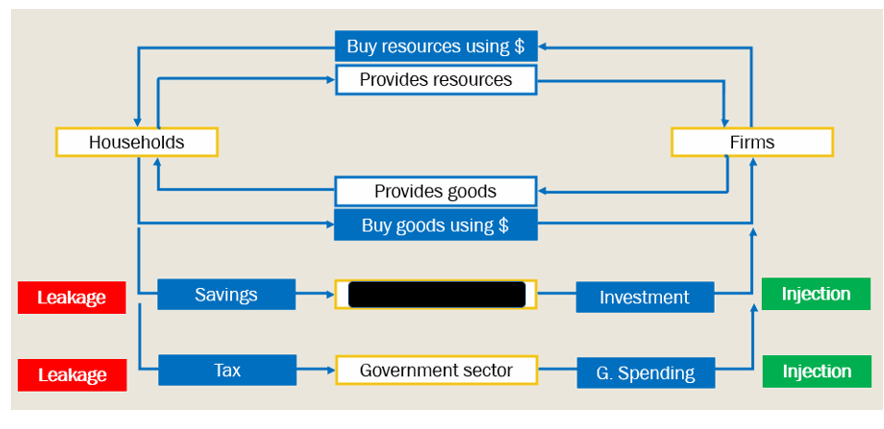
The missing label in the CFI diagram is...?
Government Sector
Financial Sector
Households
Firms

The missing label in the CFI diagram is...?
Government Sector
Financial Sector
Households
Firms

The missing label in the CFI diagram is...?
Investments
Financial Sector
Savings
Taxes

The missing label in the CFI diagram is...?
Investments
Financial Sector
Savings
Taxes

The missing label in the CFI diagram is...?
Investments
Financial Sector
Savings
Taxes

Explain the arrow
Firms pay for labour in the form of income
Firms provided goods & services
Households buy goods & services
Households provide labour to Firms

Explain the arrow
Firms pay for labour in the form of income
Firms provided goods & services
Households buy goods & services with their income
Households provide labour to Firms

Explain the arrow
Households save part of their income (deposit it banks)
Firms borrow money from the bank to expand (investment)
Households pay tax to the Government
Government spends money on public works

Explain the arrow
Households save part of their income (deposit it banks)
Firms borrow money from the bank to expand (investment)
Households pay tax to the Government
Government spends money on public works such as roads
Which of the following is an injection in the circular flow of income?
An increase in the level of household savings
An increase in the level of investment
A reduction in government expenditure on infrastructure
An increase in taxes (with government expenditure held constant)
Saving is best defined as...
that part of current income which is not spent on consumer goods and services
undertaken by those who make investment decisions
that part of current income which is spent on goods to be used immediately
the difference between income and taxation
Goods purchased for satisfaction of wants are
capital goods
final goods
Consumption goods
Intermediate goods
Factors like land labour capital are provided by
Firms
Households
Consumers
Both B and C
Factor payments are made by
Firms to household
Household to firms
--------- causes expansion of national income.
Leakages
Injections
which of the following is a leakage from circular flow of income
Savings
Taxes
imports
subsidies
Which is true about the economic system in Australia?
It is difficult for individuals to start their own businesses.
Government rules and laws make starting a business in Australia very risky.
Laws are in place to protect the rights and property of people who want to start their own businesses in Australia.
Few Australians are willing to use their money and time to start businesses because the government is likely to take their business away.
Which is an example of a capital good?
gold
health care
a factory
a diamond
Australia’s early Aborigines made economic decisions based on customs or beliefs . This would be an example of a
market economy.
free enterprise system.
traditional economy.
command economy.
What has helped Australia to have a high GDP?
poor healthcare
modern factories and technology
natural resources that are hard to develop
workers with low-paying jobs
Tariffs and quotas are alike because they both
restrict or limit trade between countries.
completely stop trade between countries.
increase trade between countries.
make trading a lot easier between countries.
Which trade barrier discourages trade by placing a tax on foreign goods?
Embargo
Quota
Subsidy
Tariff
What is an important role of entrepreneurs in the Australian economy?
They sell stocks in the stock market.
They provide new jobs for Australian workers.
They shut down factories that are not making much money.
They take care of sick patients.
Which is an example of investing in capital goods by a company?
providing health care for workers
providing classes for workers to learn new skills
keeping an old machine to see if it will last longer
buying new computers to build products more quickly
Who sets the price for goods in Australia?
Buyers and sellers agree upon price.
The governor-general sets prices for most goods.
Parliament sets a price for all goods in the country.
Prices for goods are set based on customs and beliefs of the Aborigines.
List three sources of income.
The employer must contribute how much Superannuation
9%
8.5%
9.5%
10%
National income does not include_____
Wages and salaries
Rent and Royalty
Student scholarship
Corporate Tax
In a circular flow of income, we have:
Production
Distribution
Disposition
All above

