wayground logo

Free Printable Worksheets

NEW

Font size

S
M
L
XL
Worksheets

Unit 1: Nature of Science Review

Total questions: 40

Worksheet time: 2hrs 16mins

Name
Class
Date
1.
Molly investigated if the age of students caused them to be better drivers. What is the independent variable?
a)
Type of car
b)
Skill of driving
c)
Age of student
2.
Molly investigated if the age of students caused them to be better drivers. What is the dependent variable?
a)
Type of car
b)
Skill of driving
c)
Age of student
3.
This variable in an experiment is the one being deliberately changed by the scientist. 
a)
dependent variable
b)
independent variable
c)
data
d)
control group
4.

The parts of the experiment that remains the same for the control and experimental groups.

a)
constants
b)
control
c)
independent
d)
dependent
5.

A custodian notices some dirty tables and wants to know which cleaner is the best to use. He tests three different cleaners and looks at how well they clean compared to tap water. What is the control group?

a)

type of cleaner

b)

tap water

6.
Ramone wants to know: does the distance a person kicks a soccer ball effect how well they will do on their math test.  What is the dependent variable?
a)
How far they kick the soccer ball
b)
who the person is
c)
how well they do on the math test
d)
Type of soccer ball.
7.
This part of the experiment serves as a basis of comparison; the one variable being tested has been omitted. 
a)
experimental group
b)
control group
c)
data
d)
variables
8.

Why do we use graphs in science?

a)

to record and display data

b)

to show trends in data

c)

to predict what will happen if we extend the experiment

d)

all of these are correct

9.

What is wrong with this graph?

a)

The dependent variable is not labeled.

b)

The data that is graphed is incorrect and a different graph should have been used.

c)

The intervals on the x and y axis are written incorrectly.

d)

The color of the graph is not appropriate or professional

10.

Time such as minutes, days, and months will always be a(n) ________________ variable when graphing.

a)

Controlled

b)

Independent

c)

Dependent

d)

Extraneous

11.

What is the independent variable in this graph?

a)

Tadpoles

b)

Year

c)

Frogs

d)

Number of tadpoles in the pond

12.

What part of this data table will be graphed on the Y-AXIS?

a)

The food cooked

b)

Type of barbecue

c)

The time

d)

The temperature

13.

The x-axis represents the

a)

independent (manipulated) variable.

b)

dependent (responding) variable.

c)

control group.

d)

controlled/constant variable(s).

14.

The y-axis represents the

a)

independent (manipulated) variable.

b)

dependent (responding) variable.

c)

control group.

d)

controlled/constant variable(s).

15.

Which kind of graph would you use to show how the price of bread has changed over time?

a)

line

b)

bar

c)

circle/pie

16.
a)
The dependent variable is total cost
b)
The dependent variable is weight
c)
The independent variable is total cost
d)
The independent variable is cost of a package
17.
Does the temperature of water affect the time it takes a sugar cube to dissolve? What is the IV (independent variable) in this experiment?
a)
IV: Type of water
DV: Dissolving rate
b)
IV: Temperature of water
DV: type of sugar cube
c)
IV: Temperature of Water
DV: Dissolving Rate
d)
IV: Time
DV: Number of sugar
18.
The dependent variable is the one
a)
you measure.
b)
you change.
19.

What are the three metric base units?

a)
mass,length,grams
b)
meters,length,grams
c)
measuring,liters,games
d)
meters,liters,grams
20.
Give the correct symbol:  meter
a)
m
b)
M
c)
mm
d)
MM
21.
Give the correct symbol:  millimeter
a)
m
b)
M
c)
mm
d)
MM
22.
What is the base unit in the following:
             mL
a)
Meters
b)
Liters
c)
Grams
23.
What is the base unit in the following:
             mg
a)
Meters
b)
Liters
c)
Grams
24.

1 Kg ___ 100 g

a)

>

b)

<

c)

=

25.

3,000 g = ______ kg

a)

3

b)

30

c)

300

26.

What is an example of qualitative data?

a)

The color of a substance

b)

the mass

c)

the length

d)

None of these

27.

In a measurement, significant figure consist of the digits known ___________.

a)

only

b)

plus one estimated digit

c)

plus two estimated digits

28.

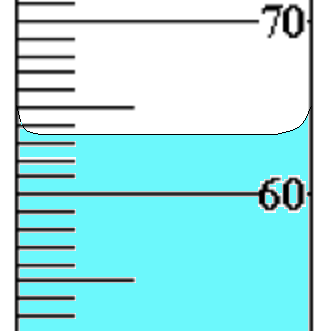
Which is a VALID measurement for this volume?

a)

63.5 mL

b)

63 mL

c)

63.55 mL

d)

6 mL

29.
A claim is ______________________________.
a)
a kind of shellfish often used in chowder. 
b)
a fact.
c)
a statement or conclusion that answers the original question or problem
d)
a bad thing to make about something.
30.
Evidence is ___________________
a)
A statement or conclusion that answers a question
b)
Scientific data that supports the claim
c)
A justification that connects the claim to the evidence
d)
Not vital when using an argument
31.
Reasoning is __________________.
a)
A statement of conclusion that answers the original question/problem
b)
Scientific data that supports the claim
c)
A justification that connects the evidence to the claim
d)
Empirical Evidence
32.

The base measurement for mass is...

a)

kilogram

b)

liters

c)

grams

d)

meters

33.
1000 m = ___________ km
a)
100
b)
10
c)
1
d)
0.1
34.
15.6 L = ___________ mL
a)
15,600
b)
156,000
c)
1,560,000
d)
15,600,000
35.
Which unit is the smallest?  
a)
km
b)
mm
c)
m
d)
cm 
36.

240 cm = ___________ m

a)

2400

b)

24

c)

2.4

d)

0.24

37.

648 g = ____ mg

a)

6,480

b)

64,800

c)

648,000

d)

64.8

38.

7,000 g = ____ kg

a)

70

b)

700

c)

7

d)

0.07

39.

3 km = ___________ mm

a)

30

b)

300

c)

3,000

d)

3,000,000

40.
180m = ___dm
a)
8
b)
18,000
c)
1,800
d)
18