
 Worksheets
The Mad Science Inquiry Skills Quiz
Total questions: 55
Worksheet time: 33mins

An experiment test the effect of light on sprouting of beans.
One beaker with sand is put in light for 24h.
Another beaker is in a dark room.
Both beakers were given 30 ml of water.
______________________________________
The seed in the dark could be best described as :
Control
Experiment
Placebo
Variable
An experiment test the effect of light on sprouting of beans.
One beaker with sand is put in light for 24h.
Another beaker is in a dark room.
Both beakers were given 30 ml of water.
______________________________________
What was the factor which was changed on purpose?
Amount of light
The water
The temperature
The place the seed was put in
An experiment test the effect of light on sprouting of beans.
One beaker with sand is put in light for 24h.
Another beaker is in a dark room.
Both beakers were given 30 ml of water.
______________________________________
What factor was measured?
Amount of light
Time taken to sprout
The temperature
The place the seed was put in
An experiment test the effect of light on sprouting of beans.
One beaker with sand is put in light for 24h.
Another beaker is in a dark room.
Both beakers were given 30 ml of water.
______________________________________
At the start, the scientist said "the bean in the light will sprout the fastest" -- this is an:
Inference
Observation
Prediction
Conclusion
An experiment test the effect of light on sprouting of beans.
One beaker with sand is put in light for 24h.
Another beaker is in a dark room.
Both beakers were given 30 ml of water.
______________________________________
There is a mistake in this experiment -- which was to:
use 30 ml of water in both beakers
put one beaker in the dark
not turning off the light at night
use cotton wool instead of sand

Your friend: "My basket ball bounces higher than yours".
You: "Prove it!"
What should your friend do?
Drop both balls from the same height and check which bounces higher
Throw both walls against a wall and check which bounces furthest
Drop the balls from different heights and check which bounces higher
Throw the balls to the ground and check which bounces higher

When reading a scale on a measuring cylinder, you must (choose all that apply):
Read at the centre of the meniscus
Keep eyes at water level
Read at the edge for higher accuracy
Read at room temperature

What is the mass on day 13?
46 g
48 g
50 g
Not possible

A teacher noticed the following points about a student doing a test.
---
What is an example of an INFERENCE?
The student was silent
The student was scratching her head
The student was sighing
The student obviously did not study

A Bunsen Burner unattended for a long time should be:
turned on highest setting so that the flame does not go out
turned on Yellow flame
turned off
leave it

A student measured how long 5 blue candles burnt.
He then measured how long 5 red candles burnt.
He took the average of each experiment and compared both.
---
What question did the student try to answer?
Does the colour of a candle affect how hot it burns?
Does the number of candles tested affect the average burning time?
Do all candles of the same colour burn at the same rate?
Do coloured candles burn at a different rate from plain candles?

What is the reading on the scale?
0.6
0.75
1.0
1.5

What is a fair test?
one variable is changed and all other conditions are kept the same
all variables are changed and exactly one condition is kept the same
change as many variables as possible in the test
change only the control variables

You test whether the YELLOW or BLUE flame of a Bunsen burner heats up water faster.
---
List 2 factors that influence the results of your experiment:
1: water temperature
2: time of day
1: water purity
2: beaker size
1: flame distance to water
2: amount of water
1: Bunsen position
2: water colour

You test whether the YELLOW or BLUE flame of a Bunsen burner heats up water faster.
---
What equipment do you need?
Bunsen burner, tripod, gauze mat & beaker
Bunsen burner, tripod, gauze mat & distillation apparatus
Bunsen burner, tripod, gauze mat & evaporation dish
Bunsen burner, tripod, gauze mat & funnel

You've measured whether hot or cold water is able to dissolve sugar better. In your discussion it says:
"I couldn’t have made anything better"
---
What is wrong with this discussion?
The discussion should discuss results
The discussion should include the method
The discussion should include the hypothesis
The discussion should include the setup
You've measured whether hot or cold water is able to dissolve sugar better. Your results reads:
"Sugar 2 -- Hot 4"
---
What is wrong with the presentation of results?
Units are missing
Results are just fine
Results must contain the independent variable
Results should state the hypothesis

Look at the table -- when you graph the data, it should contain labels for the axis. What label is appropriate for the HORIZONTAL axis?
Container
Volume (ml)
Suffocating time (sec)
Independent Variable
Look at the table -- when you graph the data, it should contain labels for the axis. What label is appropriate for the VERTICAL axis?
Container
Volume (ml)
Suffocating time (sec)
Dependent Variable
Look at the table -- the Volume (ml) data goes on the horizontal axis. Your axis steps are 0, 50, 100, 150, 200, 250, 300, 350, 400, 450, 500, 550, 600
---
Is this acceptable?
Yes, sure!
No way!
Look at the table -- the Suffocating time (sec) data goes on the vertical axis. Your axis steps are 0, 5, 10, 15, 20, 25, 30, 35
---
Is this acceptable?
Yes, sure!
No way!
For example: keep bread at room temp, and keep another one in the refrigerator- here you are changing the temps on purpose to see what happens.
For example: measuring the amount of mold on bread

rain gauge
Observation/Question, Make a Hypothesis, Do Background research, Conduct an Experiment, Analyse your data, Report your results.
Observation/Question, Make a Hypothesis, Analyse your data, Do Background research, Conduct an Experiment, Report your results.
Observation/Question, Do Background research, Make a Hypothesis, Conduct an Experiment, Analyse your data, Report your results.
Observation/Question, Do Background research, Conduct an Experiment, Make a Hypothesis, Analyse your data, Report your results.

Which senses are used in the laboratory (SELECT ALL THAT APPLY)
Smell
Sight
Hearing
Taste

How to best measure the mass of a cool drink in a bottle?
Place the bottle of cool drink on a digital balance
Use a graduated cylinder
Measure the mass of the same volume of water.
Measure the mass of the full and empty bottle -- then find the difference

What graph is best suited to show the number of petals* for different flower types (*petal = coloured leaves of a flower).
Pie graph
Line graph
Bar graph (or column graph)
Line graph (or column graph)

Which description best defines a "hypothesis"?
A hypothesis is a record of what we actually see.
A hypothesis is an expression of what we think is happening
A hypothesis is a description which needs to be followed in order to obtain results.
A hypothesis is a general statement or explanation which can be tested by an experiment.

A student measured the heights of four other students in the class. The heights recorded
were 1.40 m, 1.35 m, 1.50 m and 1.30 m. The average height of the students was:
1.30 m
1.35 m
1.40 m
1.45 m
Which piece of equipment should you use to measure out liquids?


The table shows the measurements of plant growth during one week. The measurements show that:
plant height increases each day
the plant reached its greatest possible height on Friday
the plant started to grow thicker on Thursday
the rate of growth was greatest later in the week

The table shows the temperature data of a water kettle and how long it takes to heat up 500 ml of water. To display the data it is best to use a:
line graph
a bar graph or a column graph
a bar graph or a line graph
a line graph or a column graph

You have the following values for a variable:
4, 9, 12, 18, 22, 27
For a line chart, you choose the following range & interval
from 4 to 27, interval = 3
from 5 to 25, interval = 5
from 0 to 30, interval = 5
from 0 to 100, interval = 5

You'll design an experiment to investigate which Coffee cup material is best to keep the heat. What are 2 CONTROL VARIABLES?
size of cups
amount of hot coffee
temperature of coffee
time in minutes

What do all graphs have? (SELECT ALL THAT APPLY)
A title
Axes labels
Equal axis intervals
Data units
You'll design an experiment to investigate which Coffee cup material is best to keep the heat. The DEPENDENT VARIABLE is:
material of coffee cup
amount of hot coffee
temperature of coffee
time in minutes
You'll design an experiment to investigate which Coffee cup material is best to keep the heat. The INDEPENDENT VARIABLE is:
material of coffee cup
amount of hot coffee
temperature of coffee
time in minutes
The table shows the temperature data of a water kettle and how long it takes to heat up 500 ml of water. What is an appropriate title for this table.
The Effect of Heating Time on Temperature of 500 mL of Water
Temperature vs Heating Time
The Effect of Temperature on Heating Time
Does heating time affect the temperature of water?
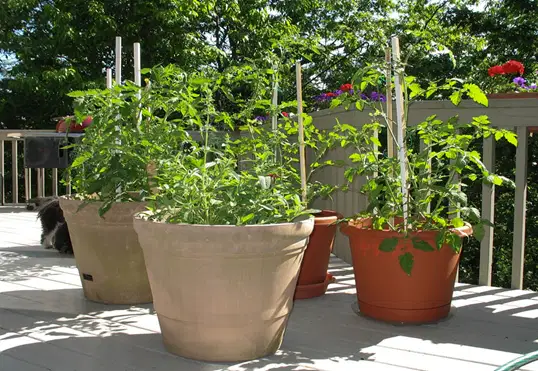
An hypothesis is "If you increase the amount of fertiliser given to tomatoes plants then they will produce more tomatoes".
The data showed that the control group produced 2.2 kg of tomatoes on average, while adding 20 grams of fertiliser resulted in 3.4 kg of tomatoes on average.
What is a suitable conclusion?
“The hypothesis has been supported. An increase in amount of fertiliser did increase the amount of tomatoes produced. Plants getting no fertiliser produced 2.2 kg of tomatoes; with 20 grams of fertiliser 3.4 kg of tomatoes were produced on average.”
“The hypothesis has been supported as shown by the data."
The experiment showed that fertiliser affects the growth of tomatoes."
“The hypothesis was that if you increase the amount of fertiliser given to tomatoes plants then they will produce more tomatoes. Whether the tomatoes were edible could not be determined by the experiment. The experiment was overall valid and reliable and fun too."
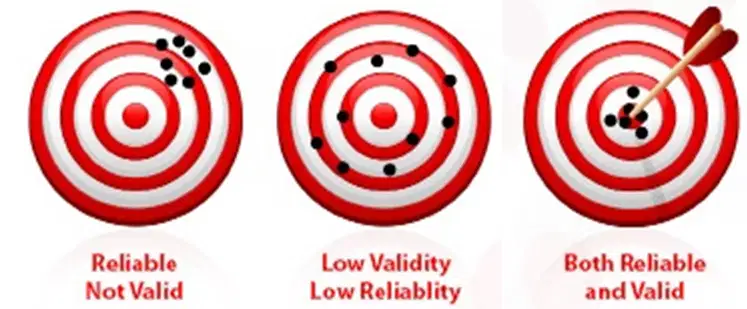
What are the 3 main ways to ensure experimental data is fair?
1) Ensure the experiment is valid and reliable
2) Include prior knowledge in planning
3) Discuss patterns and trends in data
1) Include a question and observation.
2) Include background and a preliminary study.
3) Write a proper hypothesis.
1) Having a control and an experimental group.
2) Controlling as many variables as possible.
3) Large sample size & averaging results.
1) Having an independent and dependent variable.
2) Having an appropriate title for your graph.
3) Ensure to write a proper method.
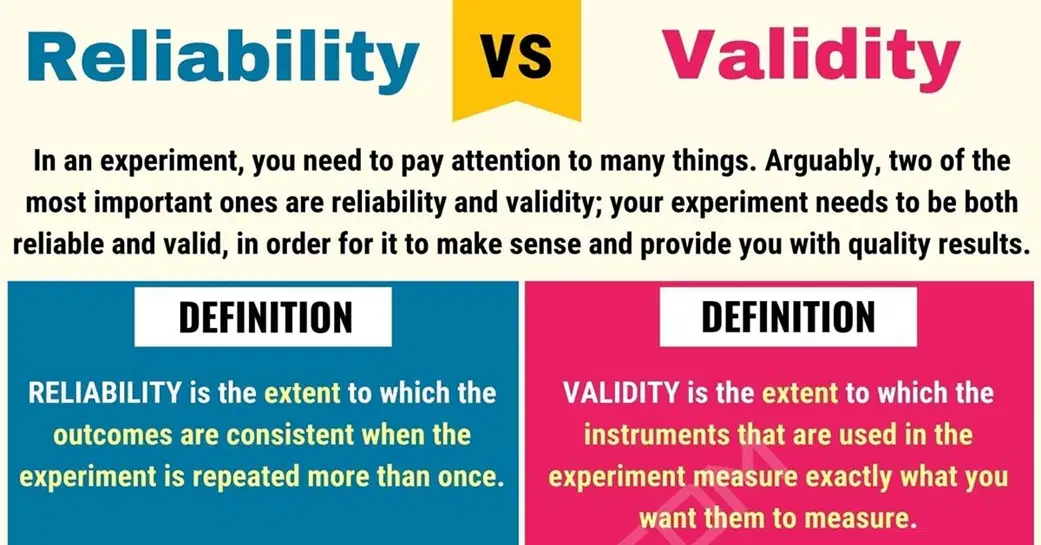
How do you make sure an experiment is reliable and valid?
Repeating the experiment with modified parameters and adjusting the equipment used.
Repeating the experiment and making sure the equipment & method are fit for purpose.
Repeat with different equipment at least 5 times and take the average.
Write down a hypothesis and a method and test the hypothesis.
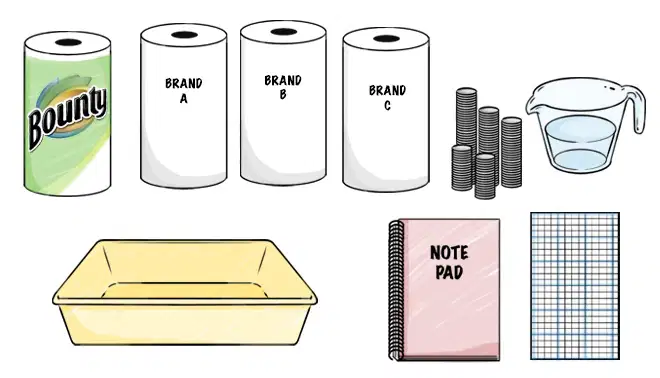
You are to design an experiment that test the absorbency of various paper towel brands. What you really want to know is if more expensive brands also absorb better. Phrase a hypothesis for this question that can be tested with a suitable experiment.
Do more expensive paper towel brands absorb more water?
I believe that more expensive paper towel brands can absorb more water because they are more expensive.
When paper towel brands absorb more water then they must be more expensive because they use better quality material.
If paper towels are more expensive, then they absorb more water.
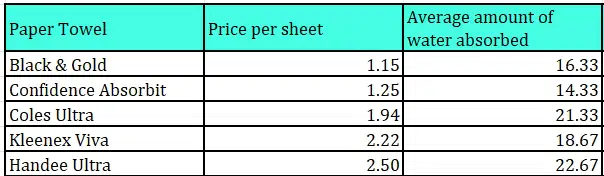
What type of graph would be suitable for the data table shown?
Bar graph with Paper Towel as Independent Variable and Amount of Water Absorbed as the Dependent Variable
Bar graph with Paper Towel as Dependent Variable and Amount of Water Absorbed as the Independent Variable
Line chart with Paper Towel as Independent Variable and Amount of Water Absorbed as the Dependent Variable
Line chart with Price per Sheet as Independent Variable and Amount of Water Absorbed as the Dependent Variable

