
 Worksheets
Unit 6 EOC Review
Total questions: 52
Worksheet time: 3hrs 53mins
1 2 3 4 5 6
0 1 2 3 4
0 1 1 2 3 4
67, 74, 95, 98, 98, 99, 102
67, 74, 95, 98, 98, 99, 102
67, 74, 95, 98, 98, 99, 102
67, 74, 95, 98, 98, 99, 102
10 12 13 15 16.5


How do you calculate the IQR?
Q2 - Q1
Q1 - Q3
Q3 - Q2
Q3 - Q1

Find the mean.
8
7
9
10
Find the Mean Absolute Deviation: 10, 9, 3, 8, 10. The Mean is 8
5
2
3
1
Find the Mean Absolute Deviation: 5, 11, 2, 7, 16.
The Mean is 8.2
1.2
3.2
4.2
2.8

Which interval shows the greatest number of pets?
15-19
0-4
5-9
10-14
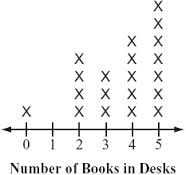

What value is the lower quartile (Q1)?
66
58
60
64


Which graph represents histogram?


How many total students were included in this histogram?
13
15
12
10
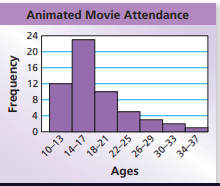
What is the shape of the data?
symmetrical
skewed left
skewed right
uniform

What is shape of the data?
uniform
skewed left
skewed right
symmetrical

What is the shape of the data?
symmetrical
skewed left
skewed right
uniform

What is the shape of the data?
symmetrical
skewed left
skewed right
uniform

Where is the gap in the data?
17
19
22
26

Which statement best describes the graph?
The data is skewed left.
The data is symmetrical.
There is a peak between 10 and 14 hours.
There is a cluster between 5 and 9
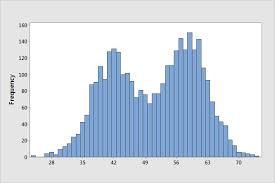
What is the shape of the distribution?
Skewed Left
Skewed Right
Unimodal
Bimodal
Multimodal



How many females were surveyed?
45
73
16
12


What are the coordinates of the outlier?
(1,9)
(9,1)
(2,2)
y=x


What does the value, r= -0.89, tell us about the linear relationship of two quantitative variables?
Strong positive
Weak positive
Strong negative
Weak negative
Time Spent Watching TV & Grades
Distance traveled vs. amount of gas in the car
Positive Correlation
Negative Correlation
No Correlation
Hours in the mall vs. amount of money spent
Positive Correlation
Negative Correlation
No Correlation

Estimate the correlation coefficient
r = 1
r = -1
r ≈ -0.8
r ≈ 0.8
r ≈ -0.5




