Wayground logo

Free Printable Worksheets

Font size

S
M
L
XL
Worksheets

Bivariate Analysis

Total questions: 40

Worksheet time: 3hrs 48mins

Name
Class
Date
1.
What type of association does this graph have?
a)
positive
b)
negative
c)
none
d)
all of the above
2.
Based on the graph, if Joe earned $400, how many hours did he work?
a)
20 hours
b)
35 hours
c)
45 hours
d)
15 hours
3.
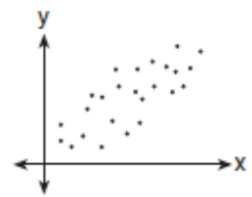
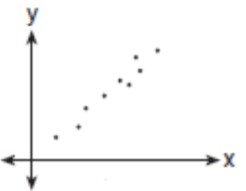
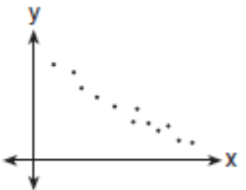
What type of correlation does this graph have?
a)
positive linear
b)
negative linear
c)
positive nonlinear
d)
negative nonlinear
4.
Which scatter plot shows a LINEAR relationship between x and y?
a)
Graph A
b)
Graph B
c)
Graph C
d)
Graph D
5.
Which sentence describes the relationship shown on this scatterplot?
a)
As the temperature decreases, the visitors increase. 
b)
As the temperature increases, the number of visitors increases. 
c)
As the visitors increase, the temperature decreases. 
d)
No correlation
6.
As the age of the car increases, its value decreases. Which scatterplot represents this relationship?
a)
A
b)
B
c)
C
d)
D
7.
As x increases, y increases
a)
both positive and negative correlation
b)
no correlation
c)
positive correlation
d)
negative correlation
8.
What type of correlation (association) would we see in the scatter plot of the following situation?
The outside temperature and the amount of layers of clothing you wear. 
a)
Positive correlation
b)
Negative correlation
c)
No correlation
d)
All of the above
9.
The scatter plot below shows the number of books read by students in Mrs. Hall’s English class and their final grades. Which statement represents the best description about the line of best fit?
a)
The more books students read, the lower their English grade.
b)
The more books students read, the higher their English grade.
c)
The fewer books students read, the higher their English grade. 
d)
No relationship exists between the number of books students read and their English grades. 
10.
Which of the following lines represents the line of best fit for the scatter plot?
a)
A
b)
B
c)
C
d)
D
11.
What would be the correlation be between study time and test grades?
a)
positive correlation
b)
negative correlation
c)
no correlation
d)
cannot be determined
12.

How are correlations graphically represented?

a)

through a model

b)

through a table

c)

through a scatter plot

d)

through box plot

13.

A study showed that a decrease in the cost of carrots led to an increase in the number of carrots sold. Which statement best describes this relationship?

a)

positive correlation and a causal relationship

b)

negative correlation and a causal relationship

c)

positive correlation and not a causal relationship

d)

negative relationship and not a causal relationship

14.

Estimate the correlation coefficient for this scatterplot.

a)

A) r = -0.9

b)

B) r = 1

c)

C) r = 0.9

d)

D) r = -1

15.
r=-0.89
a)
Strong positive 
b)
Weak positive 
c)
Strong negative 
d)
Weak negative 
16.
r=0.3
a)
Strong positive 
b)
Weak positive
c)
Strong negative
d)
Weak negative 
17.
Determine the Correlation Coefficient and decide whether it is weak, moderate, or strong.
a)
-0.19 weak
b)
-0.19 moderate
c)
0.04 weak
d)
0.04 strong
18.

Is r = -0.87 strong, moderate, or weak?

a)

strong

b)

moderate

c)

weak

19.

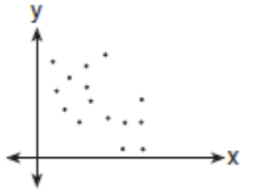
Which graph represents data that has a correlation coefficient close to -1?
a)
b)
c)
d)
20.

What type of correlation does this graph show?

a)

Positive correlation

b)

Negative correlation

c)

No correlation

d)

Constant correlation

21.
A restaurant sells pizza for the prices in the data table.  Calculate the linear regression equation of the data.
a)
y = 1.5x + 12
b)
y = 12x + 1.5
c)
y = 0.67x - 8
d)
y = -8x + 0.67
22.
A person travels by car.  They record their miles driven in a data table.  Calculate the linear regression equation of this data.
a)
y = 61.93x - 1.79
b)
y = -1.79x + 61.93
c)
y = 0.016x + 0.03
d)
y = 0.03x + 0.016
23.
The chart below tracts starting salaries for health care workers since the year 2000. Using linear regression, find the equation of best fit. Round decimals to 3 places.
a)
y = 839.721x + 27541.812
b)
y = 27541.812x - 839.721
c)
y = 27541.812x + 839.721
d)
y = 839.721x - 27541.812
24.

Find the equation of the line of best fit for the given data

a)

y = 163.41x+1.49

b)

y =- 163.41x+ 4.19

c)

y =- 4.19x+163.41

d)

y = 4.19x -163.41

25.

Write the linear regression equation for the following data points. Round to the nearest hundredth.

a)

y=−0.83x+0.61y=-0.83x+0.61

b)

y=−0.83x+0.63y=-0.83x+0.63

c)

y=0.83x+−0.8y=0.83x+-0.8

d)

a2+b2=c2a^2+b^2=c^2

26.
Find the equation of the Line of Best Fit from the data set. 
a)
y = 0.892x - 1.82
b)
y = 1.82x - 5.02
c)
y = 0.796x + 5.02
d)
y = 1.82x + 5.02
27.
The table shown is comparing a person's foot length to their height in cm. Calculate a line of best fit.
a)
f(x) = 25.05x + 5.57
b)
f(x) = 5.57x + 25.05
c)
f(x) = -5.57x + 25.05
d)
f(x) = 5.57x - 25.05
28.
Shelia collected data on ticket sales for the homecoming dance.  If she plots the data on the scatterplot shown above, which equation best models the table?
a)
y = 4.22x + 20.98
b)
y = 4.22x - 20.98
c)
y = -4.22x + 20.98
d)
y = -4.22x - 20.98
29.
The scatter plot shows the relationship between the number of chapters and the total number of pages for several books.  Use the trend line to predict how many chapters would be in a book with 180 pages. 
a)
12 chapters
b)
15 chapters
c)
18 chapters
d)
21 chapters
30.
If Joe worked 30 hours, how much is he expected to earn?
a)
$600
b)
$200
c)
$1000
d)
$800
31.
Make a prediction for a resting heart rate after 6 hours of exercise a week.
a)
6
b)
50
c)
55
d)
59
32.
About how many male math teachers were there in 2006?
a)
15
b)
30
c)
35
d)
45
33.

Phil collected data from several of his friends about the number of hours they spent sleeping and the number of hours they spent playing video games on Saturday. He recorded the data in the scatterplot. Based on the scatterplot, what is the best prediction of the number of hours one of Phil's friends spends sleeping when the friend spends 1 hour playing video games?

a)

9 hours

b)

10 hours

c)

7 hours

d)

8 hours

34.

Students in a science class investigated how the speed of changes with the air temperature outside. The data is shown in the scatterplot. Based on the scatterplot, what is the best prediction of the speed of sound when the air temperate is 50 degrees C?

a)

350 m/s

b)

355 m/s

c)

360 m/s

d)

380 m/s

35.

The scatterplot shows the number of people in each of 8 different households and the average amount of money each household spent on groceries. Based on the scatterplot, what is the best prediction of the average amount of money spent on groceries for a household that has 7 people?

a)

$240

b)

$190

c)

$210

d)

$300

36.

The scatterplot shows the average number of hours each of 13 people spends at work every week and the average number of hours each of them spends on recreational activities every week. Based on the scatterplot, what is the best prediction of the average number of hours a person spends at work every week if that person spends an average of 10 hours on recreational activities each week?

a)

33 h

b)

85 h

c)

50 h

d)

65 h

37.
Data was collected on the weight of a male  laboratory rat for the first 25 weeks after its birth. The linear regression equation is 
y= 40x+100, where x is number of weeks and y is weight in grams. 
What does the y-intercept mean in context of the problem?
a)
The predicted weight of the rat in year 0. 
b)
The predicted weight of the rat at birth. 
c)
The current weight of the rat. 
d)
The average increase in the rat's weight. 
38.
Which of the following statements is not true of the correlation r between the lengths in inches and weights in pounds of a sample of brook trout?
a)
r must take a value between -1 and 1.
b)
r is measured in inches.
c)
If longer trout tend to also be heavier, then r>0.
d)
r would not change if we measured the lengths of the trout in centimeters instead of inches.
39.
Which is TRUE?
I.  Random scatter in the residuals indicates a linear model.
II.  If two variables are very strongly associated, then the correlation between them will be near 1 or -1.
III.  Changing the units of measurement for x or y changes the correlation coefficient.

a)
I only
b)
II only
c)
I and II only
d)
I, II and III
40.
Which is the best CONTEXTUAL description of the y - intercept for the linear regression equation of the rats: Weight = 100 + 40(Time)?
a)
The y-intercept is 100, which means the rat is predicted to weigh 100 grams at birth. 
b)
The y-intercept is 100, which is where the graph crosses the y-axis. 
c)
100 is where the data starts on the y-axis. 
d)
The y-intercept is 100, which means at a weight of 0, the rat will take 100 seconds.