
 Worksheets
End of 2022
Total questions: 82
Worksheet time: 21hrs 30mins
When does an object falling vertically through the air reach terminal velocity?
when the acceleration of the object becomes negative
when the acceleration of the object is greater than g
when the air resistance equals the weight of the object
when the air resistance is greater than the weight of the object

An athlete runs a 100m race in a straight line. The table shows how his speed changes with time for the first 0.5s of the race. What is the average acceleration of the athlete between time 2.0s and time 3.0s?
1.6m/s²
1.9m/s²
4.9m/s²
5.7m/s²
The gravitational field strength on the Moon is 1.6N/kg. An astronaut has a mass of 75kg. What is the weight of the astronaut on the Moon?
47N
75N
120N
740N

Two objects P and Q are placed in a beaker containing a liquid. Object P floats in the liquid and object Q sinks. Which row for the densities of object P, object Q and the liquid is possible?
A
B
C
D
A ball of mass 0.12kg is hit by a tennis player. The velocity of the ball changes from 0m/s to 5m/s in 0.60s. What is the average resultant force acting on the ball while it is being hit?
1.0N
2.5N
3.6N
8.3N
A small, light ball is dropped from the top of a tall building. Which graph shows how the speed of the ball changes with time?


A runner runs 300 m at an average speed of 3.0 m/s. She then runs another 300 m at an average speed of 6.0 m/s. What is her average speed for the total distance of 600 m?
2.0 m / s
4.0 m / s
4.5 m / s
8.0 m / s

The balloon exerts a downward force of 0.09 N on the top-pan balance.
The helium has a mass of –9 g
The helium has a mass of +9 g.
The resultant downward force on the top-pan balance is 0.91N
A liquid has a volume of 0.040 m³ and a mass of 30 000 g.
What is the density of the liquid?
0.075 kg/m³
7.5 kg/m³
750 kg/m³
7500 kg/m³
A resultant force of 4.0N acts on an object of mass 0.50 kg for 3.0 seconds.What is the change in velocity caused by this force?
4.0 m / s
6.0 m / s
12 m / s
24 m / s
Which quantities are both vectors?
acceleration and force
acceleration and pressure
density and force
density and pressure

Pressure can be exerted by solids, liquids and gases.
TRUE
FALSE
pressure= force/mass


Pressure can be measured in Pascales (Pa) or Newtons per square metre. 1 Pa = 1 N/m²
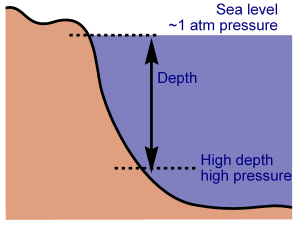
When you increase your depth under water, the water pressure on your body
increases
decreases
stays the same

Diagram shows the design of a dam. Why does the thickness of the dam increase with its depth?
The design of this structure is stronger.
Water pressure increases with depth.
The cost of construction is lower.
Water pressure acts uniformly in all directions.
The pressure exerted by a liquid
increases with depth.
decreases with depth.
is constant
first increases and then decreases.
Which of the following does not affect the pressure beneath the surface of a liquid?
Strength of the gravitational field
Area of the liquid surface
Density of the liquid
Depth of the liquid

The diagrams show, to the same scale, the vertical sections of a set of circular vessels, each containing the same depth of water.
The water exerts the same pressure on the base of each vessel.
The water exerts the greatest pressure on the base of vessel S.
The water exerts the greatest pressure on the base of vessel P.
The water exerts the same force on the base of each vessel.

The diagram shows 2 fishes in the water. The density of the water is 1025 kg/m³. The surface area of fish A is 300 cm² and the surface area of fish B is 2000cm². Find the pressure exerted by the water on fish A.
10500 Pa
20090 Pa
20500 Pa
30500 Pa

Given that the density of water is 1025kg/m3 and the surface area of fish B is 2000cm2. Find the force exerted by the water on fish B.
2100 N
4100 N
6100 N
4018 N

The figure shows the cross-section of a sea near a seaside. Find the difference of the pressure between point A and point B provided that the density of seawater is 1050kg/m3.
8400 Pa
31500 Pa
23100 Pa
22638 Pa
If the atmospheric pressure in a housing area is 100 000 Pa, what is the magnitude of the force exerted by the atmospheric gas on a flat horizontal roof of dimensions 5m × 4m?
20KN
200KN
2000KN
20000N

The figure shows a reservoir that stores water. The valve in the exit pipe is closed. The density of water is 1000 kg/m3 and the acceleration of free fall is 9.8 m/s2. Calculate the pressure of the water acting on the closed valve in the exit pipe.
30000 Pa
20000 Pa
196000 Pa
200000 Pa

Given that the cross-sectional area of the pipe is 0.5m2 and the density of water is 1000kg/m3.Calculate the force exerted by the water on the closed valve.
100 N
980 N
9800 N
98000 N

The figure shows a pond that is kept at a constant depth by a pressure-operated valve in the base. The pond is kept at a depth of 2.0 m. The density of water is 1000 kg/m3. Calculate the water pressure on the valve.
10000 N/m
20000 Pa
19620 N/m2
10000 Pa

The brick is held underwater with its largest surfaces horizontal. The density of water is 1000 kg/m3. Calculate the difference in pressure between the top and the bottom surfaces of the brick.
700 Pa
700 N/m
686.7 Pa
600 N/m2

The tank is filled with the oil of density 850 kg/m3 to a depth of 1.5 m. Calculate the force exerted by the oil on the base of the tank.
44982 Pa
12495 N
44982 N
12495 Pa
A list of various quantities is shown.
acceleration
speed
force
length
mass
velocity
How many of these quantities are vectors?
2
3
4
5
A student determines the circumference of a football.
Which instrument gives a reading that is the circumference of the football?
calipers
micrometer
rule
tape

A train sets off from a station at time t = 0. The graph shows how the distance between the train and the station varies with time.
Which statement about the movement of the train between time t1 and t2 is correct?
Its speed is decreasing and it is moving away from the station.
Its speed is decreasing and it is moving towards the station.
Its speed is increasing and it is moving away from the station.
Its speed is increasing and it is moving towards the station.
A car begins to move. It speeds up until it reaches a constant speed. It continues to travel at this constant speed for the rest of the journey.
What happens to the acceleration and what happens to the velocity of the car during the journey?
Both the acceleration and the velocity change.
Only the acceleration changes.
Only the velocity changes.
Neither the acceleration nor the velocity changes.

The speed–time graph for a car’s journey is shown.
During which part of the journey is the car moving with non-uniform acceleration?
A
B
C
D
What is measured using a micrometer?
area
current
length
mass

The graph shows a short journey. It is a speed–time graph. What is the greatest speed reached?
1 m/s
2 m/s
3 m/s
4 m/s
Which quantity is a vector?
acceleration
distance
speed
time

Stop-watches are used to time the runners in a race.
The stop-watches show the times recorded for the winner and another runner.
What is the difference in time between the winner and the other runner?
0.4608 s
6.08 s
46.08 s
608 s
Two cameras are a known distance apart. The exact time that a vehicle passes each of the cameras is recorded.
What can be obtained from the information?
average acceleration of the vehicle
average speed of the vehicle
maximum acceleration of the vehicle
maximum speed of the vehicle
What is the formula for average speed?
Time taken ÷ distance moved
Distance moved ÷ time taken
Distance moved × time taken
Time taken × distance moved
What is the gradient in a distance-time graph?
Distance travelled from the start
Time taken
Speed
Acceleration
What does a steep line correspond to in a distance-time graph?
No speed (stationary)
An accelerating speed
A fast steady speed
A large steady acceleration
How is velocity different from speed?
Speed is velocity in a given direction
Velocity is speed in a given direction
They are the same
They are not related
What is the formula for acceleration?
Change in velocity × time taken
Time taken ÷ change in velocity
Change in velocity ÷ time taken
Change in speed ÷ time taken
What is the gradient in a velocity-time graph?
Velocity of the object
Speed of the object
Distance travelled from the start
Acceleration of the object
What does a downwards line correspond to in a velocity-time graph?
Constant acceleration
Constant deceleration
Returning to start
Constant velocity
What does the area beneath a speed-time graph represent?
The average speed
The average velocity
The distance travelled
The average acceleration
If a car increases in velocity from +5 m/s to +15 m/s in three seconds, what is its acceleration?
+33.3 m/s2
+3.3 m/s2
+10 m/s2
+5 m/s2
What is the unit for acceleration?
m/s
m s2
m s-1
m s-2
A train begins a journey from a station and travels 60 km in a time of 20 minutes.
What is the average speed of the train?
3.0 m/s
5.0 m/s
50 m/s
60 m/s

Two runners take part in a race.
The graph shows how the speed of each runner changes with time.
What does the graph show about the runners at time t ?
Both runners are moving at the same speed.
Runner 1 has zero acceleration.
Runner 1 is overtaking runner 2.
Runner 2 is slowing down.

The graph shows how the speed of a van changes with time for part of its journey.
In which labelled section is the van decelerating?
A
B
C
D

A large stone is dropped from a bridge into a river. Air resistance can be ignored.
Which row describes the acceleration and the speed of the stone as it falls?
A
B
C
D

A car travels along a straight road.
The speed-time graph for this journey is shown.
During which labelled part of the journey is the resultant force on the car zero?
A
B
C
D

An object moves at a constant speed for some time, then begins to accelerate.
Which distance-time graph shows this motion?
A
B
C
D
A car travels at an average speed of 60 km/h for 15 minutes.
How far does the car travel in this time?
4.0 km
15 km
240 km
900 km

A ball is dropped from a table-top. Air resistance may be ignored.
Which row describes the velocity and the acceleration of the ball at point X?
A
B
C
D

The diagram shows the speed-time graph for a car.
Which area represents the distance travelled while the car is accelerating?
X
X+Y
Y
Y-X

Two distance-time graphs and two speed-time graphs are shown.
Which graph represents an object that is at rest?
A
B
C
D

A car moves with constant speed and then constant acceleration.
Which graph is the speed-time graph for the car?
A
B
C
D
What does the area under a speed-time graph represent?
acceleration
average speed
deceleration
distance travelled
A car travels 100 km. The journey takes two hours. The highest speed of the car is 80 km/h, and the lowest speed is 40 km/h.
What is the average speed for the journey?
40 km/h
50 km/h
60 km/h
120 km/h

The speed-time graph shows the motion of a car. Which row describes the motion?
A
B
C
D

The diagram shows the distance-time graph of an object. Which statement describes the object?
It is accelerating.
It is moving at a constant speed.
It is slowing down.
It is stationary.

The graph represents the motion of a car.
What is the distance travelled by the car while it is moving at a constant speed?
100 m
150 m
250 m
300 m

A car travels along the route PQRST in 30 minutes.
What is the average speed of the car?
10 km/hour
20 km/hour
30 km/hour
60 km/hour

The table shows the readings on a car speedometer at 5 second intervals.
Which row describes the speed and the acceleration of the car?
A
B
C
D

The diagram shows the distance-time graph for a car.
At which labelled point is the car moving with constant speed?
A
B
C
D

The graph represents the motion of a train travelling between two stations.
Which statement about the train is correct?
A Its acceleration takes a longer time than its deceleration.
It travels at constant speed for less than half of its journey time.
It travels 2000 m in the first 100 s.
It travels 10000 m at constant speed.

A car travels 6.0 km along a main road in 6.0 minutes. It then travels 2.0 km along a minor road in 6.0 minutes.
Which calculation of average speed for the whole journey is correct?
8.0 / 12.0 = 0.67 km/minute
12.0 / 8.0 = 1.5 km/minute
8.0 + 12.0 = 20 km/minute
8.0 × 12.0 = 96 km/minute

Which distance-time graph represents the motion of an object moving at constant speed?
A
B
C
D

The graph shows how the speed of a car changes with time.
Which calculation gives the distance travelled by the car in 24 seconds?
14 / 24
24 / 14
24 × 14 / 2
24 × 14
A car takes 15 minutes to travel along a road that is 20 km long.
What is the average speed of the car?
0.75 km/h
5.0 km/h
80 km/h
300 km/h

The graph shows how the speed of a car changes with time.
Between which two times is the car stationary?
U and V
V and W
W and X
X and Y

